
All you need to know about KPIs and measurement of metrics
Monitoring the performance of an organization is not an easy process. The larger the company and the number of stakeholders involved, the more difficult it is to measure the steps and processes separately. This is because, while the financial result may be good (revenue and profitability), there may be activities or processes that are not contributing significantly to the success of the company.
In order to do so, it is necessary to create improvement actions in the items identified as troublesome through key performance indicators, the famous KPIs.

Knowing where you want to get is essential in the definition of key performance indicators.
Discovering the least productive steps in a chain of internal and external services is key to gain greater competitiveness in the market and that is one of the functions of the key performance indicators. Keep reading our article to understand everything you need to know about KPIs, from specific indicators for the IT area to tips on how to apply them, what should and what should not be measured.
The concept and what are KPIs (key performance indicators)
Key performance indicators are management tools to monitor the level of performance or success of an organizational goal. Also known as KPIs, they help measuring the success of an organization in a specific or general goal, collaborating to systematically monitor the objectives, so that the managers of a company are able to check if they are in the right path to achieve them or not.
These indicators can be qualitative or quantitative, monitored either through spreadsheets (manually) or through software (automatically). KPIs also serve as a means of communication between the managers of a company and their teams, reporting the performance of a process throughout a period. Another known nomenclature for performance indicators is KSI – key success indicators.
Challenges in building KPIs
One of the greatest challenges in building a KPI is the definition of the goal to be reached. In order to do so, the manager must know exactly where he wants to get and which are the steps required to achieve this objective. Many organizations that are relatively large and have complex businesses, especially in Brazil, are still surprisingly amateur when it comes to defining accurately the objectives to be reached, the required steps to reach them and how to monitor the information (spreadsheets, dashboards or software).
One of the worst mistakes companies make is putting a lot of effort in activities that are not relevant to their core business. And this mistake is also reflected in the objectives of the performance indicators, which get more and more far away from the strategic objectives of the organizations.
In addition, often the indicators of each area are not connected to the strategic objectives of the organizations, defined through the BSC (Balanced Scorecard), for example.
Defining the objectives
In addition to the date and where you want to get, you have to use some kind of methodology to define the objectives of the KPIs. One methodology to define objectives is called SMART. This is the acronym of specific, measurable, attainable, relevant and time-bound.
Example of objective: increasing the average ticket per client by 35%, measured by a financial software, in a period of 2 years.
(S) Specific: average ticket per client;
(M) Measurable: measured by a financial software;
(A) Attainable: launching new benefits to add value to the product/service;
(R) Relevant: increasing the average ticket promotes better financial health for the company;
T) Time-bound: during one year.
Defining the goals
Goals are smaller objectives that help building a path to achieve each objective. They contribute to the measurement of each of the steps, enabling contingency measures to be taken in the event they are not achieved or partially achieved.
- Increasing the total average ticket of the base by 1.5% per month;
- Validating new contracts and values of products and services to reflect in the objective;
- Validating with clients and potential clients whether the added value of the new benefits is reflected in the price increase transferred to new clients.
Examples of KPIs monitored in different areas
Each area has peculiarities and specific goals. Therefore, it is natural that the epicenter of the concerns and the KPIs of the commercial and development areas are completely different. Check some examples of key performance indicators chosen to sample each area in our dashboard models. Other examples, from the IT area, may be viewed below:
Development KPIs
The development area has experienced several phases where the measurement of productivity and effectiveness went from the total number of code lines, function points delivered, up to indicators related to the latest practices, such as SCRUM. Some indicators that are common to different development areas are:
- Number of hours to correct bugs;
- Number of hours to correct critical bugs;
- Software updates released within the deadline;
- Number of bugs per versions released;
- Number of critical bugs per versions released;
- Division of the working period (integration activities, support and event analysis, software improvement, corrections).
Infrastructure KPIs
Infrastructure is the area of the organization that supports, through technology, all systems used by different areas of the company. In addition, it is responsible for maintaining a structure of services that are key for the work of a company, such as computers, printers, servers, telephone exchange, Internet links, and more.
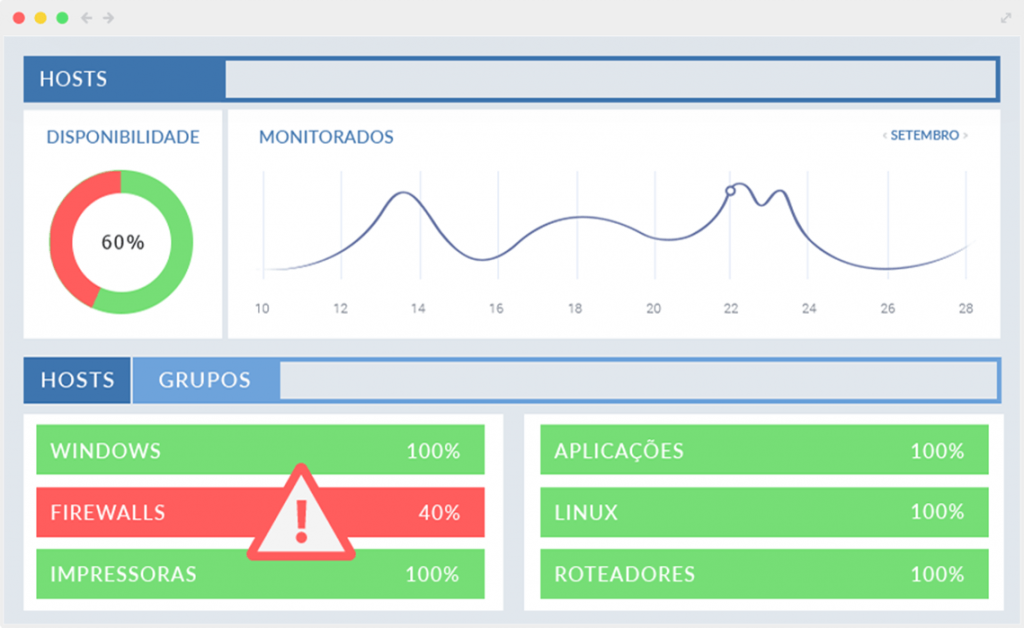
Availability Dashboard with OpMon.
Therefore, KPIs of infrastructure are extremely focused on availability and capability of assets, especially in IT. See some examples:
Service Desk KPIs
Service Desk is a system that helps companies to control all internal e external service requisitions, such as technical assistance requests, bug correction (software companies), software configuration and installation for new employees, complaints of unavailability in the systems, and more. Due to its significant impact on an organization, it has its own indicators.
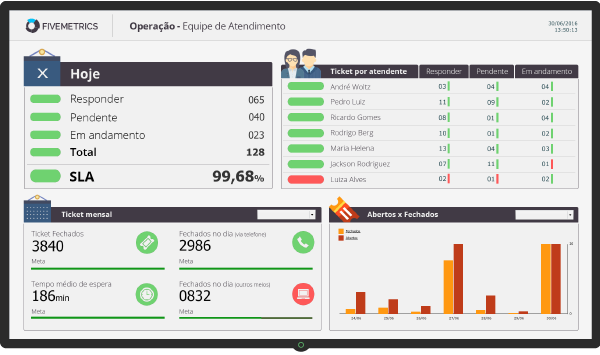
Each requisition is controlled by service level agreements (SLA), which are formal or informal contracts that define, for example, the response time of each requisition, which may vary depending on the type of service or on the criticality level. The most common service desk indicators include:
- Index of calls closed within the SLA;
- Average hours per #ticket;
- Average cost per #ticket;
- Average calls processed per attendant;
- Average idleness per attendant;
Read also our article on dashboard models with indicators of different areas. To learn more IT metrics, read the article.


