
A morte da planilha excel para a gestão de indicadores!
Não! O excel não morreu e continuará sendo usado por muito tempo como a melhor opção para construção e tabulação de planilhas e relatórios. Porém, a sua utilização não será mais aceita pela área de negócios realizar a gestão de indicadores.
…hmmm, não entendi!
Por que a sua empresa deve começar a monitorar indicadores do negócio em tempo real?
Então vamos lá! A área de negócios das empresas, a partir da necessidade de mercado de se tornar cada vez mais competitiva, exige indicadores em tempo real sobre tudo o que acontece na organização. Logo, a análise de dados do passado continuará existindo, porém a demanda por dados em tempo real será cada vez mais presente nas empresas.
O fluxo de informações perdidas dentro das organizações é enorme. Porém, cada vez mais estão surgindo ferramentas capazes de buscar estes dados e transformá-los em informações utilizáveis para a tomada de decisões.
Já tivemos várias experiências com diversos clientes, de diferentes verticais, em que transformamos indicadores que eram tabulados manualmente em planilhas de excel em dashboards com dados atualizados em tempo real. A diferença na gestão dos dois cenários é muito grande.
Ao se analisar dados consolidados do passado se perde muito tempo interpretando e dando significado às informações. Além disso, é possível ocultar informações relevantes propositalmente ou devido a erros humanos. Já a visualização de dados em tempo real permite a tomada de decisão antecipada, no momento em que os problemas ocorrem e permitindo que ações preditivias e preventivas possam ser aplicadas a tempo.
Neste artigo não vamos falar sobre questões técnicas, mas sim explicar como a lentidão no tempo de resposta impacta a ponta do seu negócio. Além disso, vamos destacar a relevância de apresentar dashboards com dados do negócio em um formato construído para se tomar decisões.
Poderíamos pegar qualquer vertical para utilizar como exemplo de como o impacto nos usuários gera perdas financeiras para a sua empresa. Para ilustrar de forma mais didática, poderíamos escolher uma loja virtual, uma área de atendimento a clientes, um portal de autoatendimento ou um sistema web possuem uma série de tecnologias que os suportam.
Em uma analogia, seria como um encanamento de uma cidade. Embora ninguém o veja ao caminhar pelas ruas, caso ocorra algum problema o impacto é muito grande para todos. Para o negócio da sua empresa significa perdas financeiras e de imagem. Gerenciar tudo isso em tempo real com alarmes automáticos e notificações enviadas diretamente para os responsáveis se torna indispensável para uma organização comprometida com a produtividade e com a satisfação dos seus clientes.
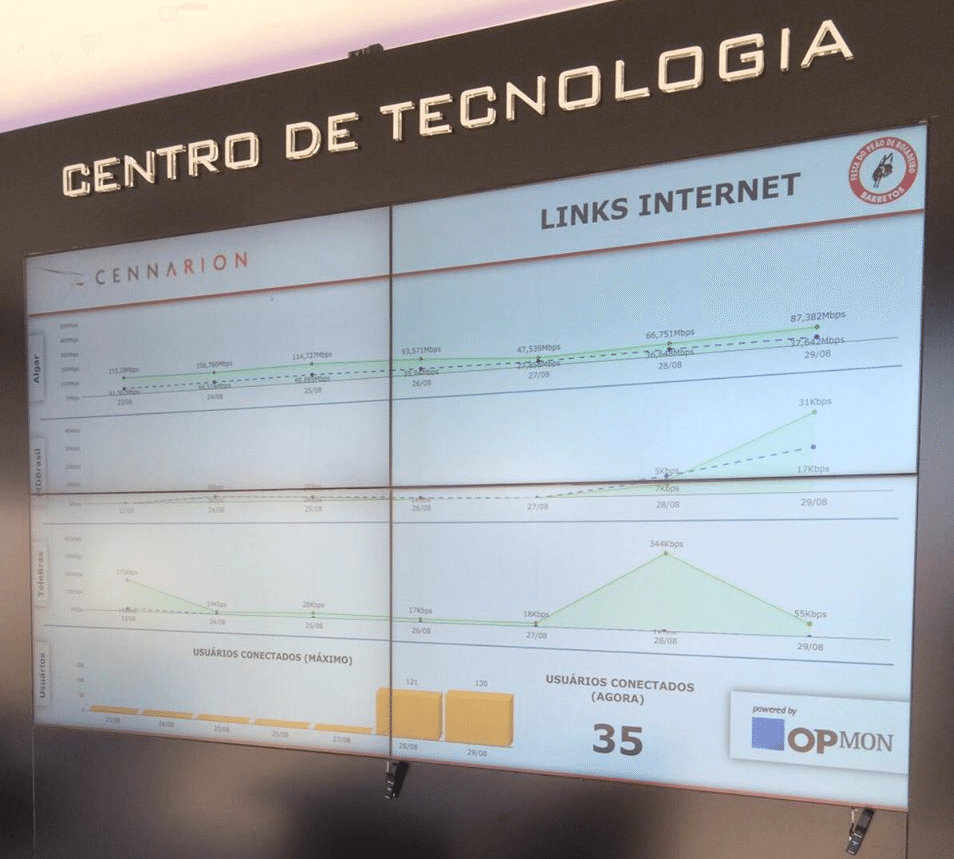
Dashboard construído para uma sala de operações de um dos nossos parceiros para monitorar os links de comunicação na festa de peão de boiadeiro em Barretos.
Por que é importante monitorar os indicadores dos processos de negócio?
Com sistemas cada vez mais complexos e mercado competitivo, as empresas precisam garantir um diferencial no seu negócio em relação aos seus competidores. Um dos caminhos que conduz a um processo de qualidade contínua e busca de excelência é poder ter controle de seus processos através de monitoramento dos principais indicadores críticos do negócio, de forma a poder proativamente tomar ações que evitem as perdas financeiras ou desperdícios de investimentos.
Vamos ilustrar este conceito com dois exemplos, sendo o primeiro deles, o monitoramento de um processo de vendas online.
A empresa que não monitora o seu processo de compra na loja virtual, pode estar deixando de vender e se quer saber que está tendo perdas financeiras. Para que haja uma venda pelo site, pelo menos as três questões abaixo são essenciais:
1. O site tem que estar no ar e passível de acesso para compra online
2. O tempo de resposta do site tem que ser menor que 1 segundo.
3. O valor do produto + frete tem que ser competitivo perante a concorrência.
Para estas três questões serem verdadeiras 24 horas e 7 dias por semana, incluindo feriados e fins de semana, é necessário monitorar toda a infraestrutura que sustenta a operação de vendas online bem como simular o que o consumidor experiencia quando faz a compra no site. Sem isso, sua empresa pode estar perdendo vendas para a concorrência e você nem sabe que poderia estar trazendo maior faturamento para a sua organização.
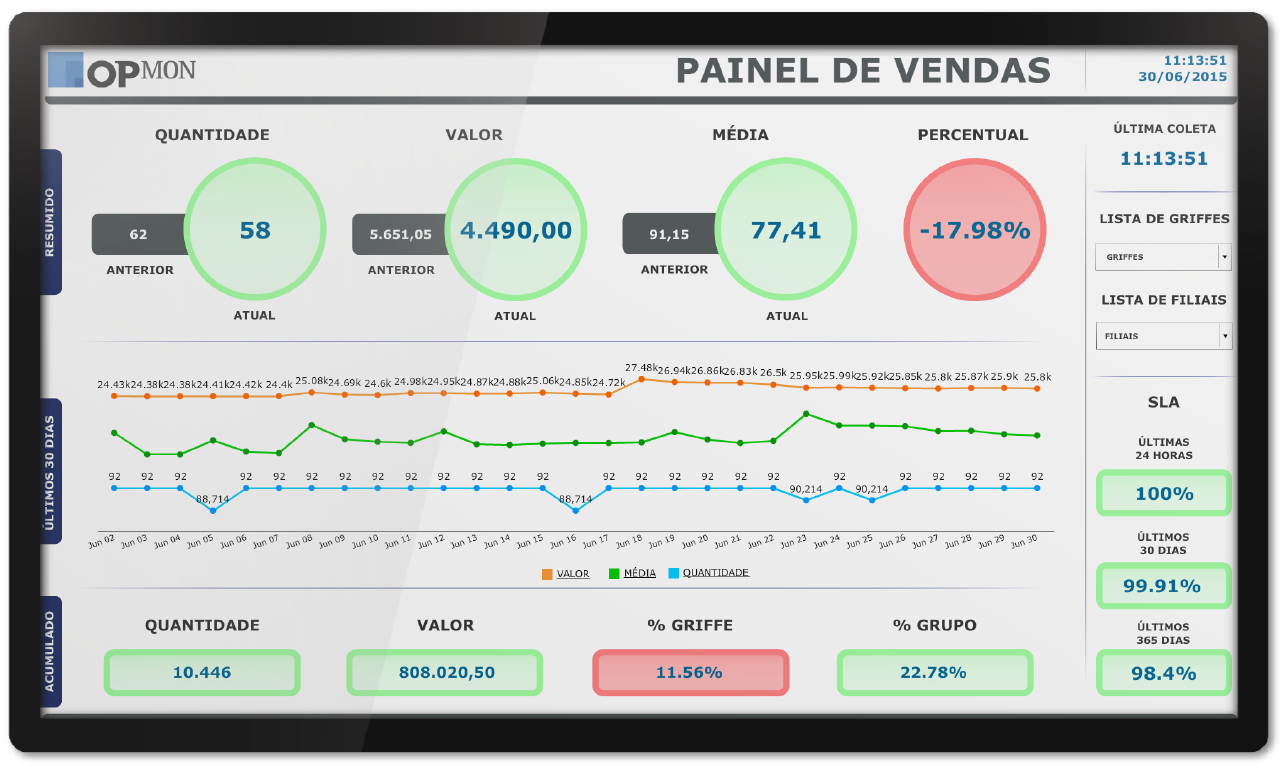
O segundo exemplo é o monitoramento de uma rede de lojas. Seguindo o conceito de que temos que ser mais competitivos , fazer diferente e ter destaque frente a concorrencia no mercado tecnológico e econômico atual, uma necessidade das organizações é de poder tomar ações de forma ágil conforme seu desempenho financeiro por produto e por loja. Monitorar estes indicadores de forma automática e em tempo real e visualizá-los minuto a minuto, podem auxiliar nas diretrizes estratégicas sem esforço hercúleo de construção de planilhas eletronicas.
Dashboard de painel financeiro
Monitoramento do negócio em tempo real!
Para mapear um processo de vendas online é preciso descobrir quais sistemas e equipamentos são necessários para que a venda seja efetuada, desde o pedido até a ordem de compra. Provavelmente serão mapeados os sistemas ERP, CRM, banco de dados, plataforma de vendas, sistemas de cartão de crédito, nota fiscal eletrônica, links de internet, servidores, entre outros.
Caso um destes itens não funcione corretamente o processo de compras em uma loja online falhará e a organização perderá dinheiro com vendas não concretizadas. Após o mapeamento deste processo, o estado de todos estes recursos vitais ao negócio poderiam estar sendo monitorados em tempo real e apresentados em dashboards. Em caso de problemas, o responsável pelo sistema ou equipamento (público interno ou fornecedor) será alarmado no exato momento em que o erro aconteça, por SMS ou e-mail. Desta forma, além de não perder dinheiro com falhas nos sistemas, a área de tecnologia e negócios consegue visualizar de forma mais clara todos os seus recursos de TI que influenciam nas vendas. Também é possível mensurar investimentos de maneira cada vez mais assertiva.
>>> BAIXE AGORA! PAPER SOBRE MONITORAMENTO COMPORTAMENTAL DO NEGÓCIO!
>>> BAIXE AGORA! CATÁLOGO DE DASHBOARDS COM INDICADORES DE DIVERSAS ÁREAS!
“O decisor área de tecnologia que não consegue falar a linguagem do negócio está condenado à obsolecência!”

O fim da planilha excel!
Ter indicadores e relatórios em tempo real e com agendamento automático é essencial para garantir a máxima produtividade da sua equipe. Utilizar dados do passado e que não estejam atualizados automaticamente minuto a minuto não condiz com as boas práticas de gestão da área de negócios e de tecnologia.
A OpServices pode ser seu parceiro estratégico na condução da automatização do monitoramento dos seus indicadores de processos de negócio através de nossa solução OpMon.