

What is BAM?
According to (research and advisory firm providing information technology related insight) Gartner, Inc., Business Activity Monitoring (BAM) describes the processes and technologies that improve the perception of a situation and allow the analysis of business performance critical indicators of a company based on real-time data. BAM is used to improve the speed and effectiveness of business operations, keeping track of what is going on and making problems visible. Its concept may be implemented using various types of software tools. In this article we will show how that implementation can be carried out through OpMon, with Visual Management dashboards, and what companies should expect or how to be prepared to absorb this technology.
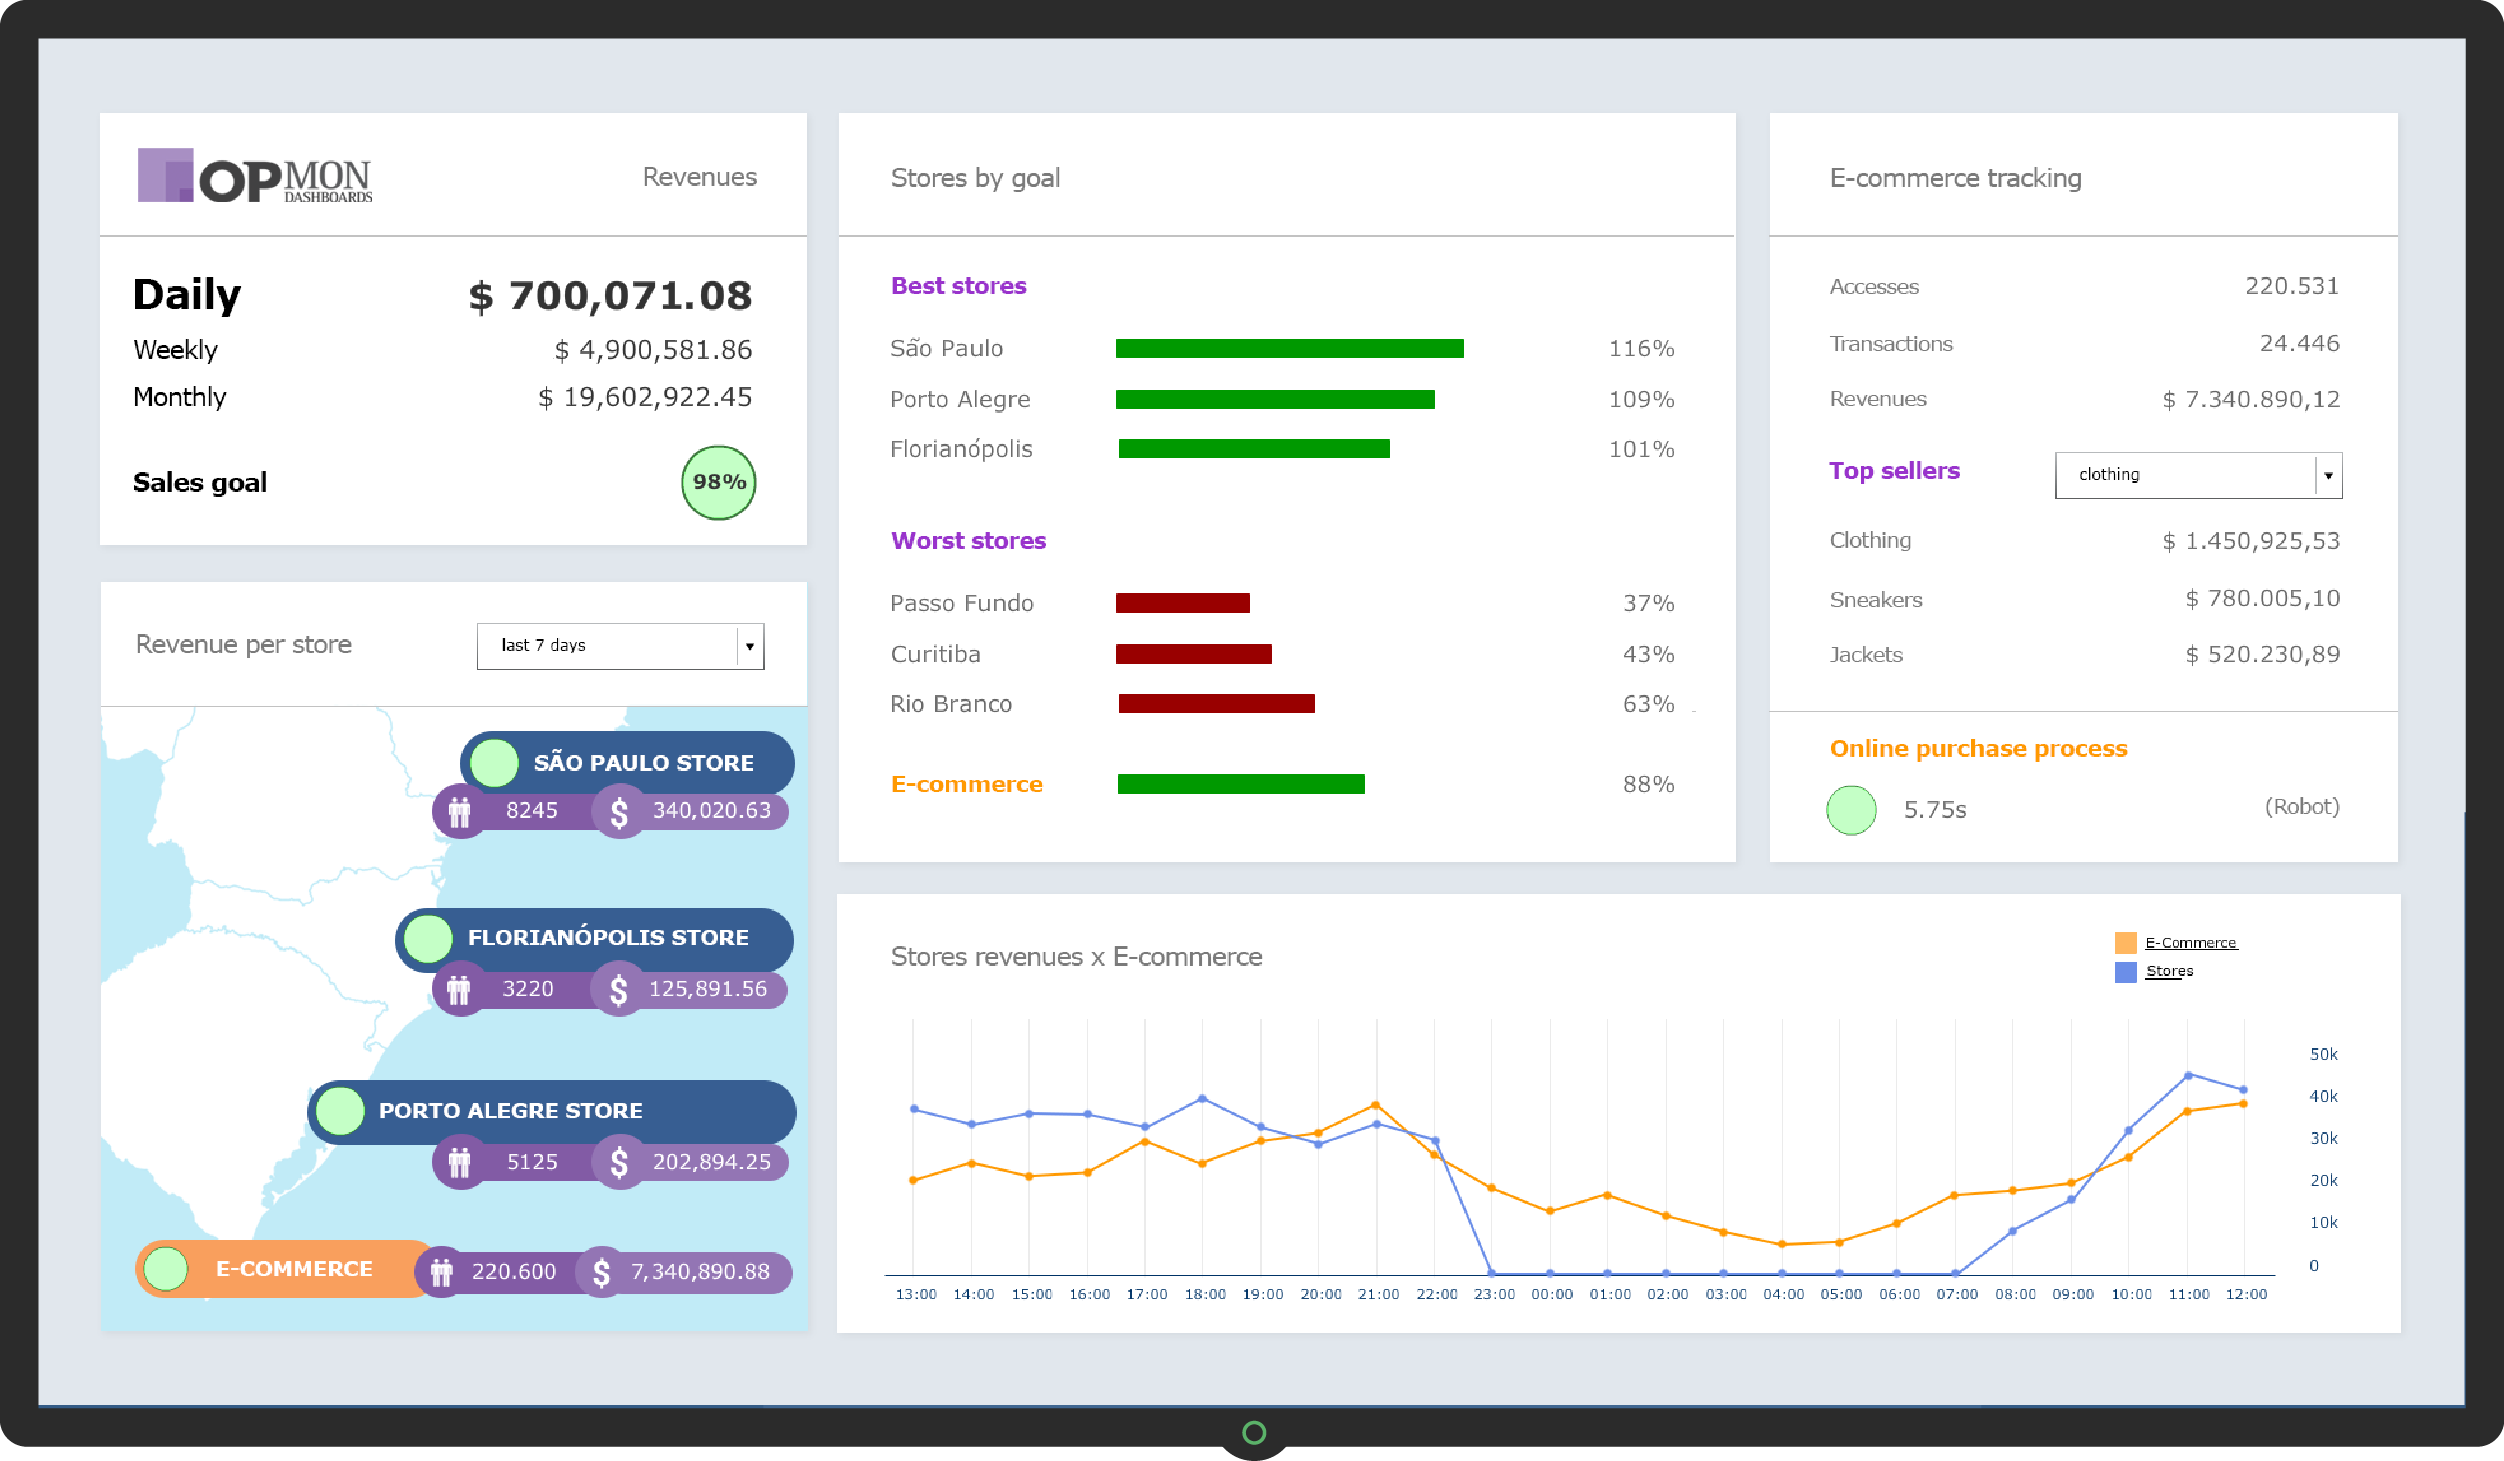
Monitoring sales indicators with data from multiple sources in real time
Business Activity Monitoring (BAM) is the term that defines how we can provide real-time access to critical indicators of business performance to increase the speed and effectiveness of business operations. Unlike traditional monitoring in real time, BAM will seek information in multiple application systems, as well as in other internal and external sources, enabling a broader and richer view of business activities. As such, it tends to be a natural extension of the investments companies are making in integrating applications in terms of data visualization.
So far, BAM is a small part of the history of integrating applications. Gartner, Inc. estimates that a very small percentage of the integrators billing can be effectively connected to BAM, even with its significant growth in recent years. Many of them do not have a strategy related to this yet. BAM scenario by the end of the last decade is much like in the BPM (Business Process Management) in the late 1990s, which went from obscurity to becoming one of the pillars of integrating applications, mergers, acquisitions and new developments in the process of running the business, besides, of course, its focus on process automation.
BAM in the coming years will grow exponentially to direct all application integration. Suppliers will depend on these systems to show competitive advantage and, in accordance with Gartner, Inc., BAM is the next big thing that the application integration vendors want and need. Despite its great potential in application integration, BAM also covers business intelligence, network and management systems, data visualization and related areas, strongly supported by the company’s businesses.
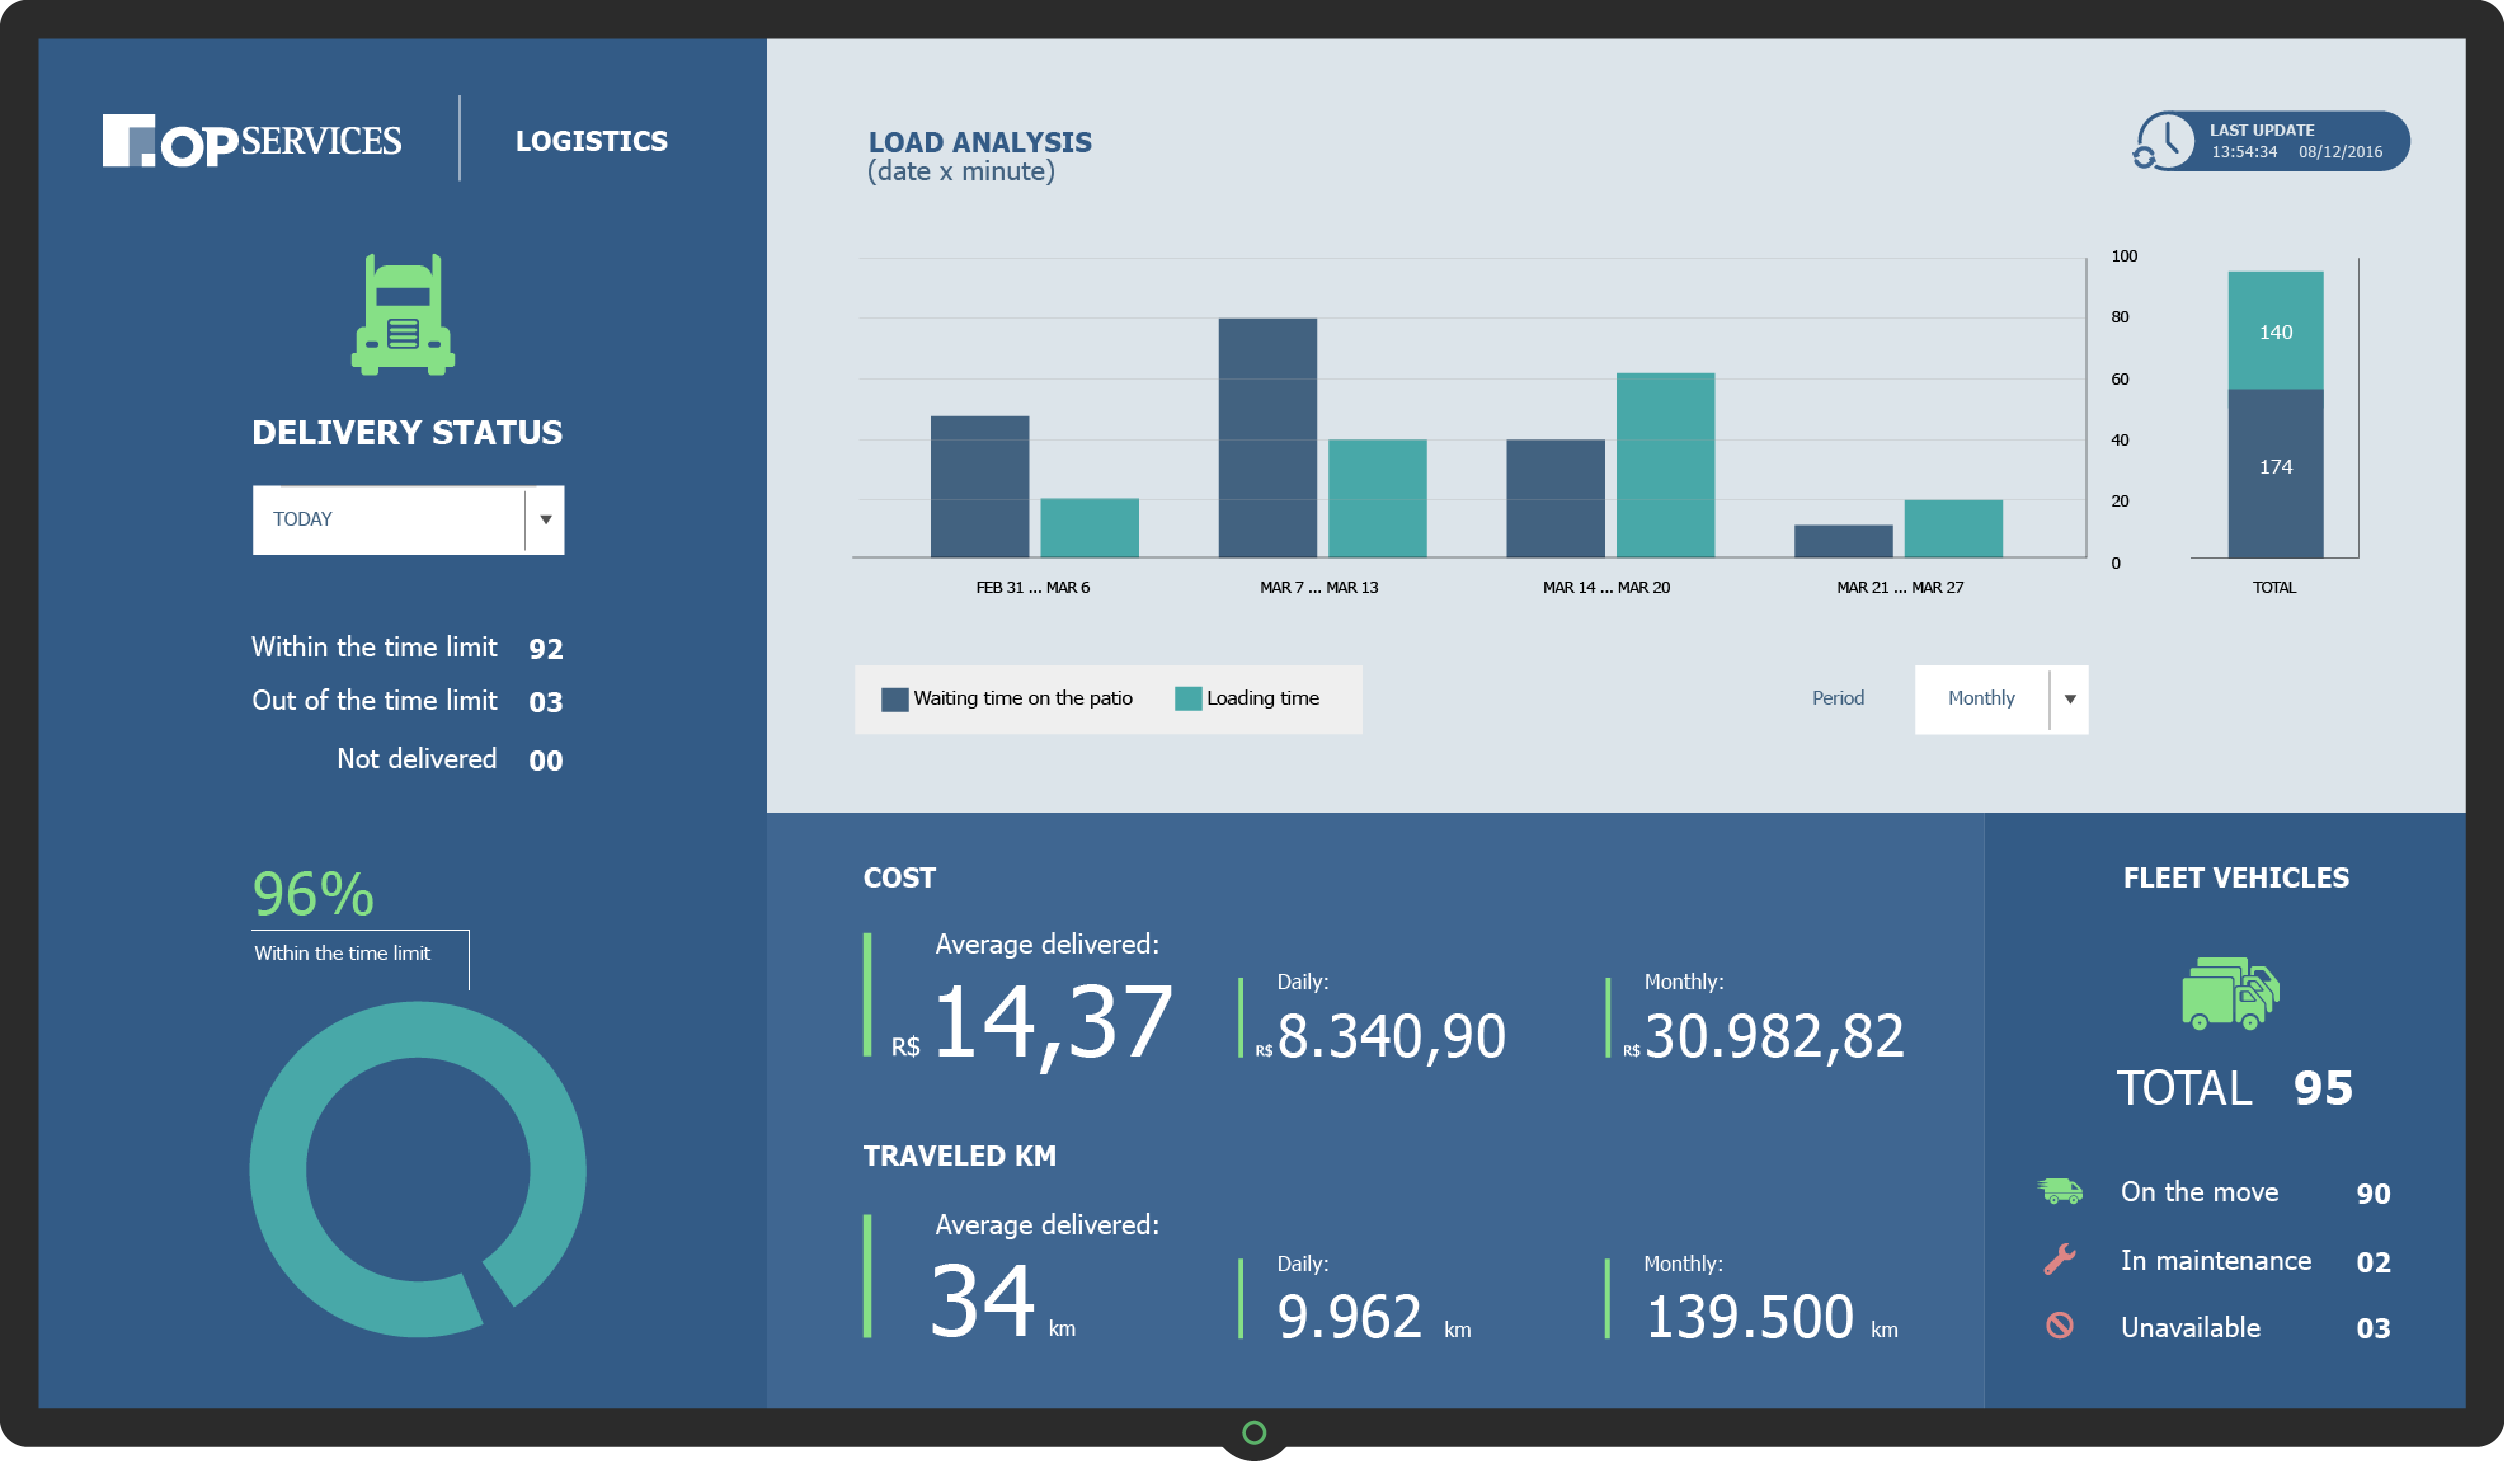
Supply Chain Management Dashboard
For OpServices, the management of business activities should act as an integrator solution of different ecosystems such as infrastructure monitoring, Enterprise Resource Planning (ERP), Business Process Management and Business Intelligence (BI), a tool that traditionally serves the management information needs. This integration of different ecosystems will be in the form of executive visualizations for decision-making and notifications and alerts to track metrics or identify problems root-cause. Among its benefits are:
- Presenting processes indicators through an intuitive vision;
- Integrating information on various systems and applications through dashboards;
- Reducing operating costs;
- Improving the performance of processes;
- Reducing latency in decision-making;
- Providing a basis for operational and strategic decisions.
Analyzing the right metrics!
To create an effective BAM environment, it is not necessary only to have the technology and monitor the right processes. Companies should define the right set of metrics, which will prevent information overload and an over-reaction to reports that should not be treated as a priority.
BAM challenges
One of the major challenges in BAM is the integration among employees in the technology and business fields. Traditionally, these two audiences have always spoken different “languages”. In addition, what is more, business knowledge has always been dispersed among sectors (human resources, financial, administrative, technology, commercial and marketing departments, etc.). Therefore, creating a visual language and a framework for processes to integrate different applications from different sectors is a task that requires an effort from BAM suppliers and customers, who should bear the responsibility for monitoring quality metrics.
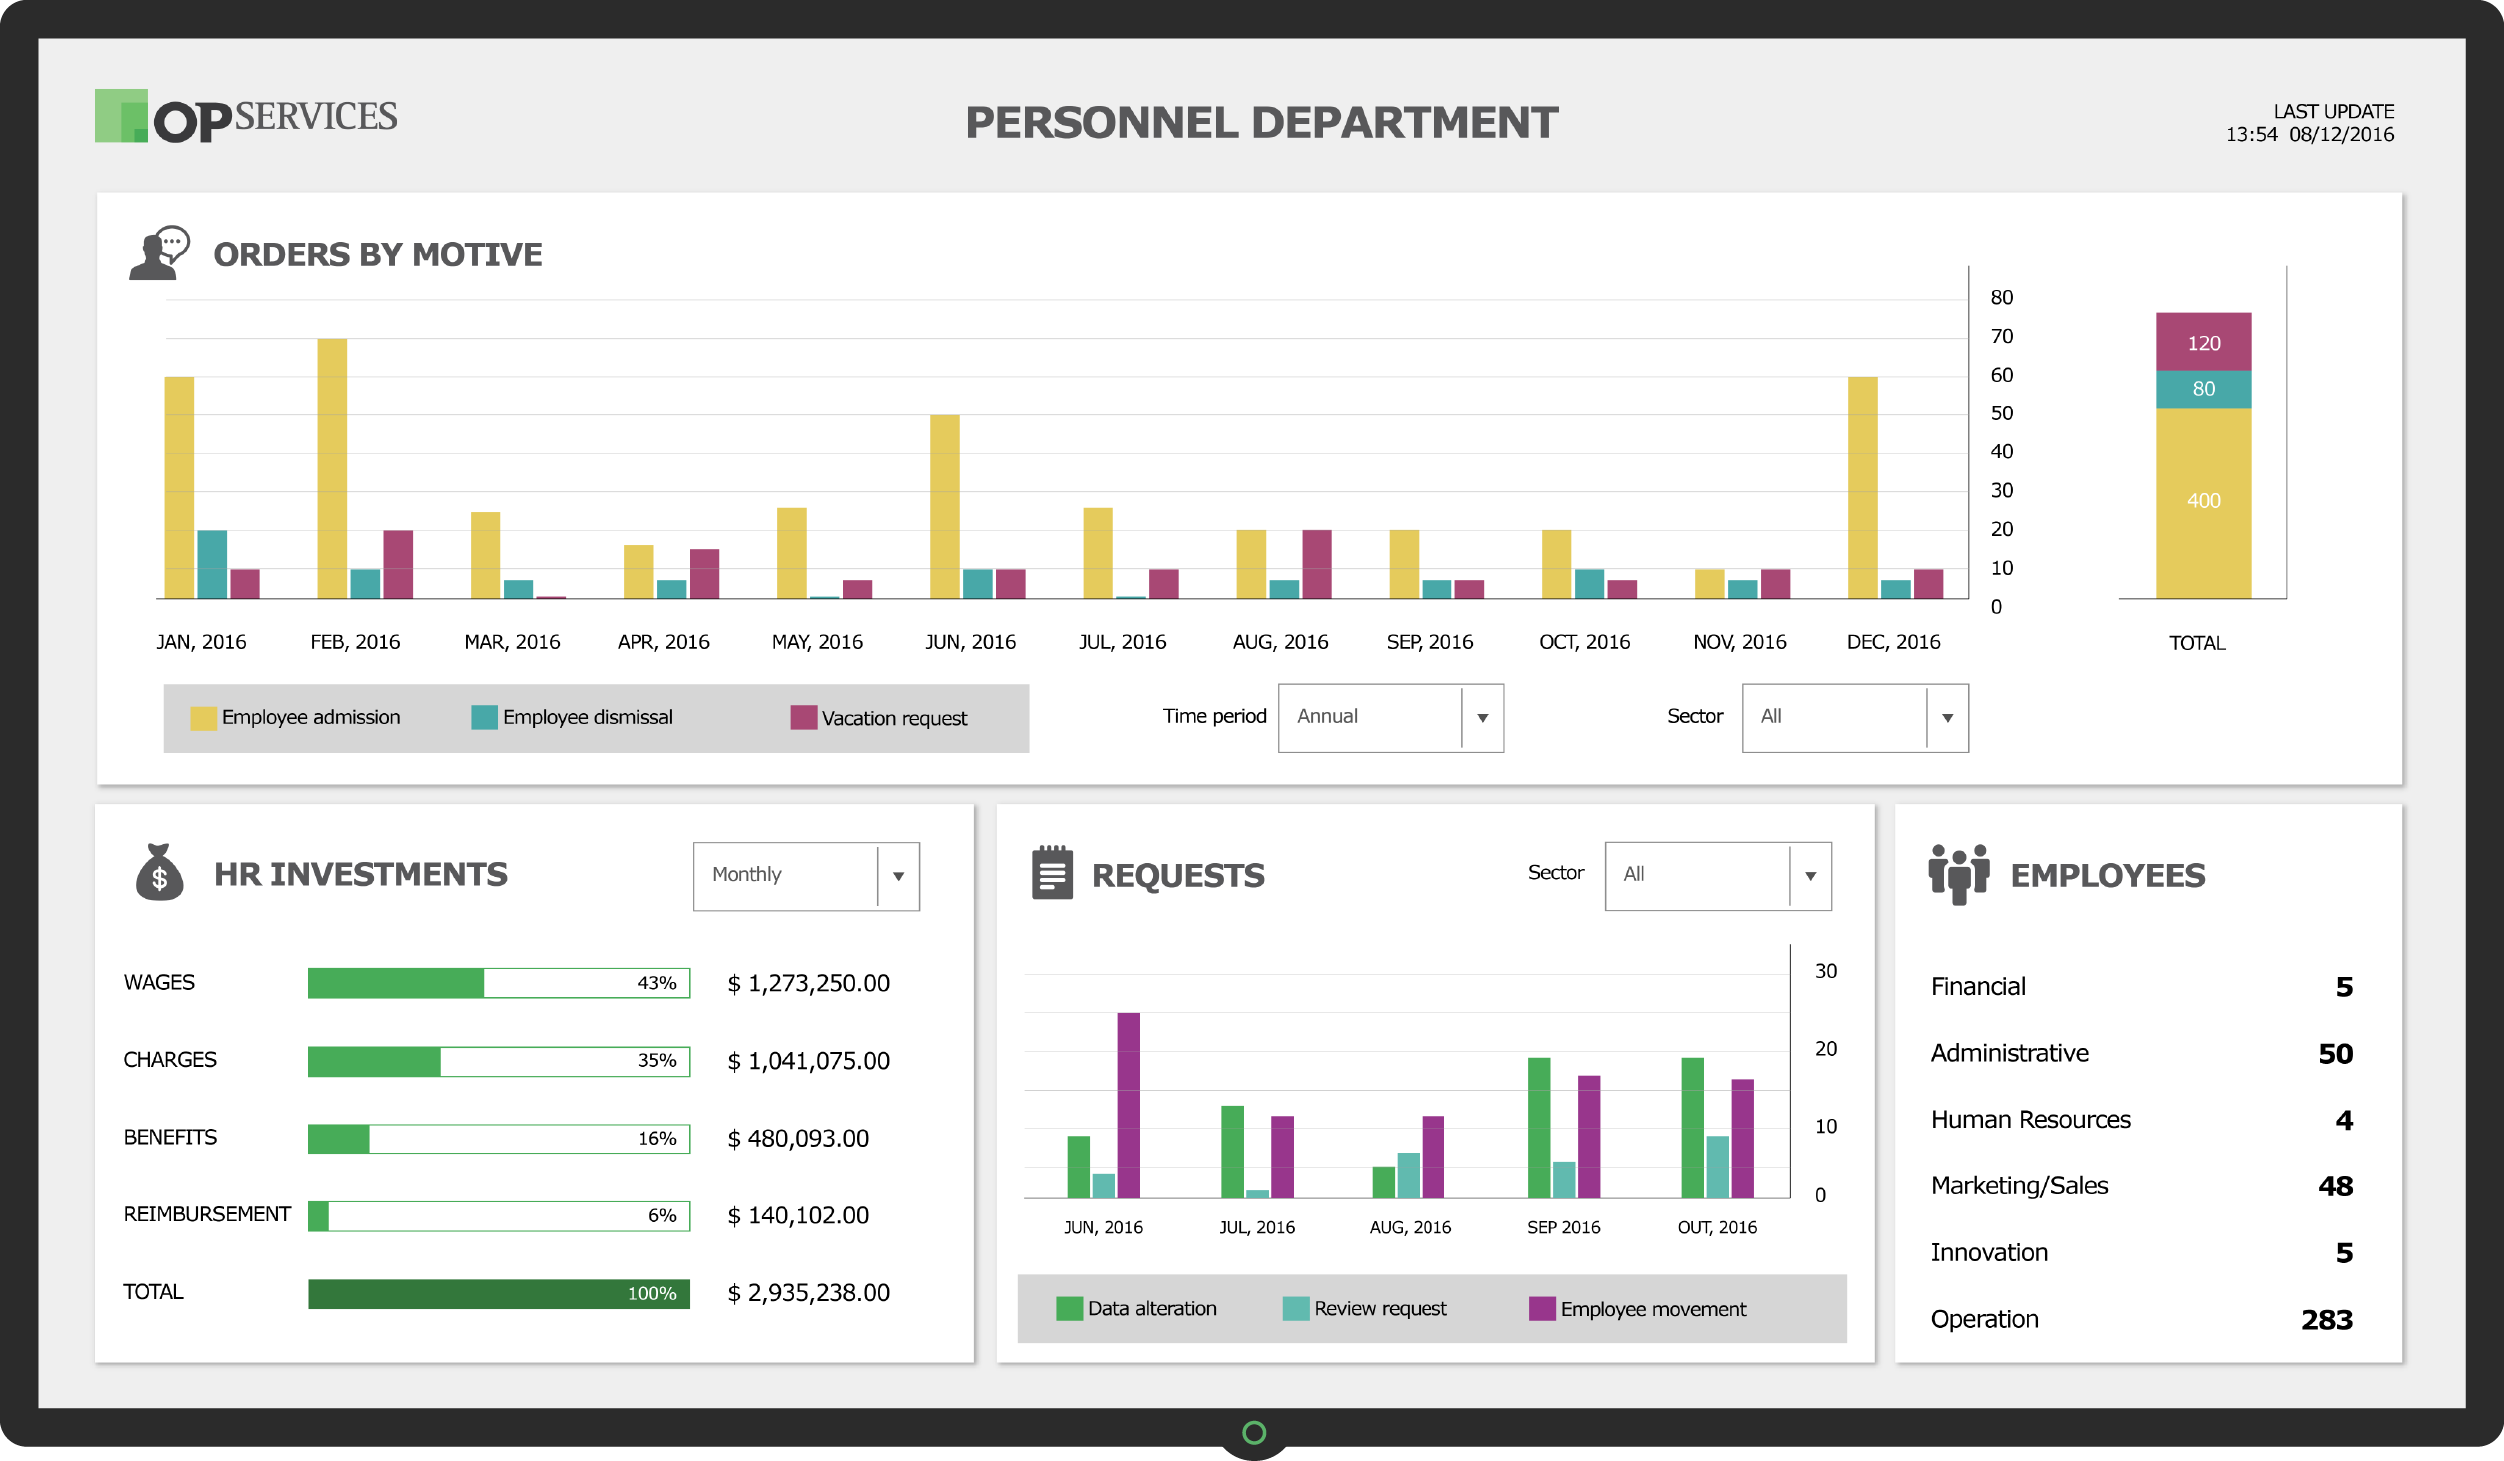
Framework Dashboard with HR indicators and multiple data sources
The BAM market
There is an overlap of markets when referring to the Business Activity Monitoring: Business Intelligence (BI) or data visualization systems, Network and Systems Management (NSM) and Application Integration Middleware (AIM). Companies intending to perform the Business Activity Monitoring should develop methods to continuously measure business results. Without a continued focus, the project may not justify the investments made or even fall into disuse by the companies’ managers and employees.
Small and medium-sized enterprises (SMEs) often do not have the in-house expertise or the resources to properly implement a BAM project and are more likely to outsource this type of operation. Large companies usually have the resources, but are still more open to outside help because they think this kind of technological development and knowledge is not within their key activities or core business. Thus, external service providers are often the wisest choice for most companies.
Centralized view of the technology ecosystem
With the increasing complexity of companies and their search for enhanced productivity, they increasingly need to systematize and automate their processes through management software, business intelligence, Enterprise Resource Planning (ERP), Business Process Management (BPM), and monitoring networks and systems, among many other applications.
The problem with the progressive enlargement in the number of systems is that they often work in isolation, generating information that is not combined and analyzed in parallel within this ecosystem. The capacity to integrate different applications and presenting the information in dashboards can be a great advantage to support decision making.
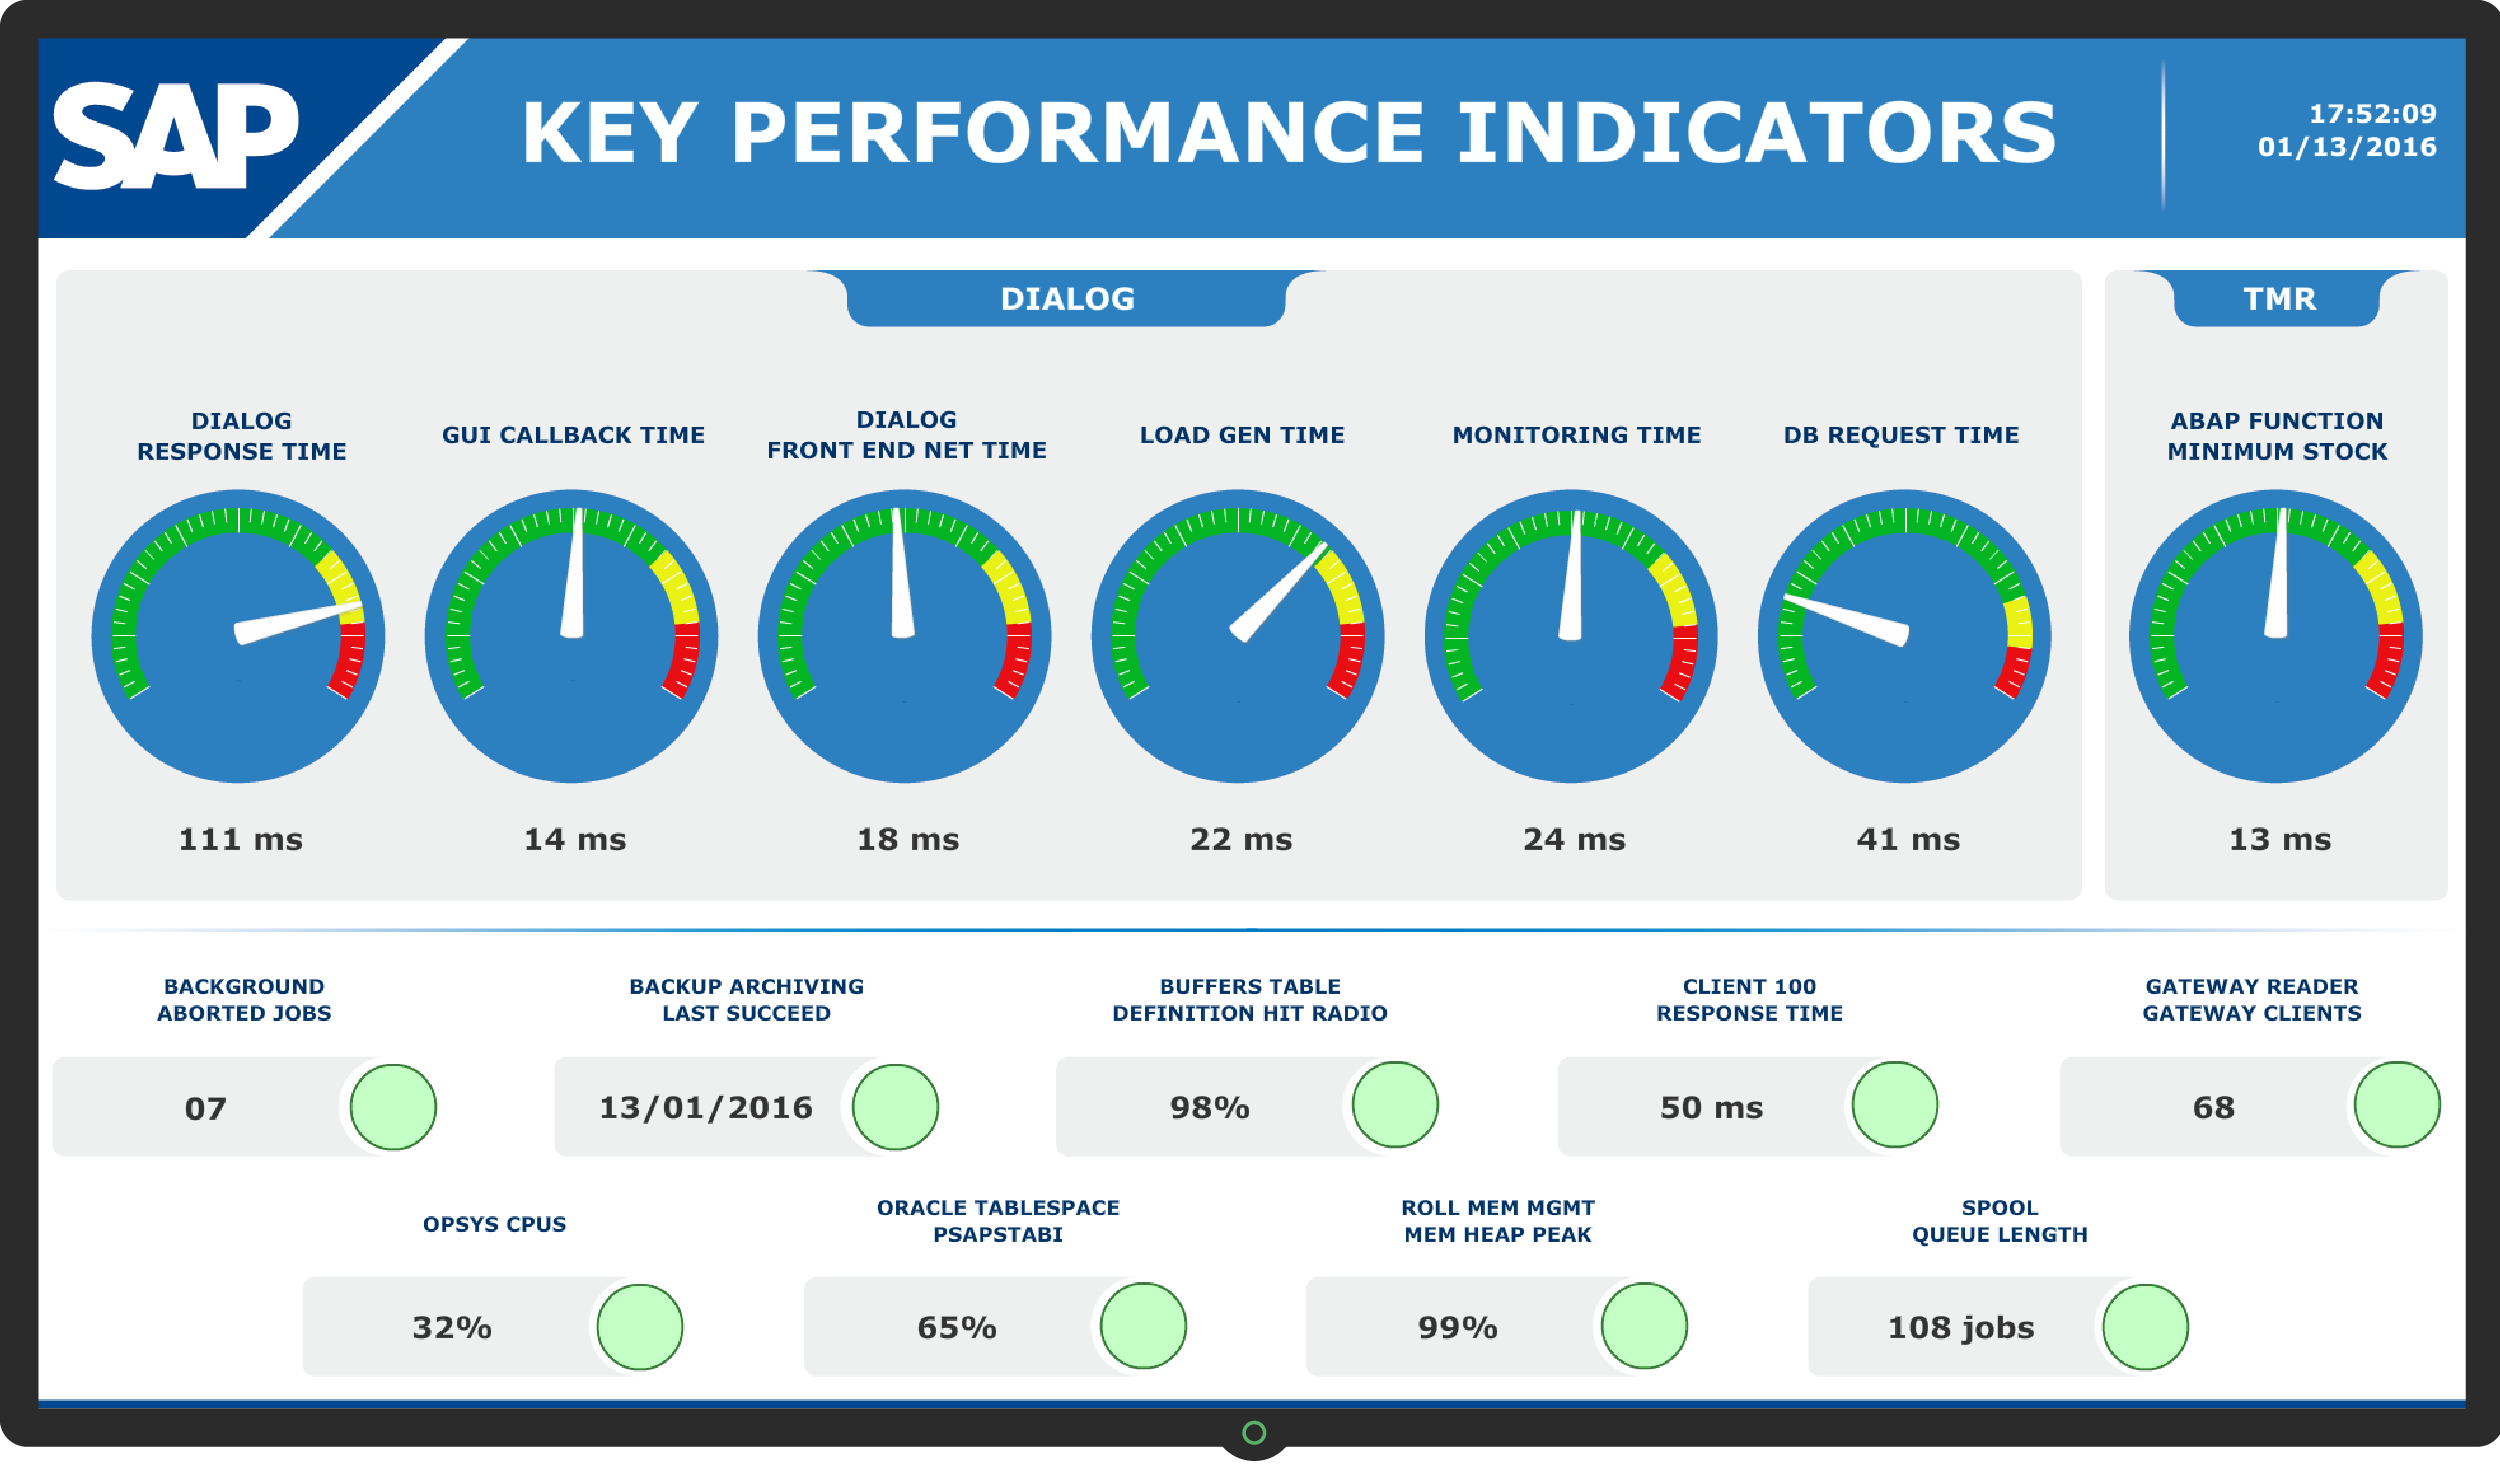
Dashboard with the vision of indicators of the SAP system
Detection of unexpected or out of set limits behavior
One of the great advantages of real-time analysis of business activities is the possibility of setting limits expected for a process to be run efficiently or for a goal of an area to be reached. Setting limits from the organizational goals allow setting alarms for the course of a business to be corrected at the time when problems occur and not through a past visualization, as is done in most cases.
SMS (Short Message Service) Alerts Automation, E-mail, Call opening
From the limits established in a business process, it is good practice to automate the generation of alarms for troubleshooting or to adjust strategic decisions. This automation may mean sending SMS, e-mail, call opening or several other types of notifications to streamline operations and course adjustments in business strategies.
In short
BAM provides means to make decisions in real time based on three pillars: (1) data visualization, (2) network/systems monitoring (3) integration among applications. OpMon, of course, can contribute within these three pillars.
SEE EXAMPLES: DASHBOARDS WITH BUSINESS ACTIVITY MONITORING
Data visualization can be created from the solution customizable dashboards. The data to be presented are collected by monitoring proactive systems of OpMon itself, conducting checks in real time. As for the integration of systems and applications, it can be achieved by the flexibility and ability of the platform to monitor any type of device or appliance that generates some kind of data. If it is possible to get the information in any way, it is possible to monitor in the OpMon and present it in a decision-making format in the OpMon dashboards.
Related Posts
Understand what is Business Activity Monitoring
Visual Management and real-time business processes monitoring
The death of the excel spreadsheet to manage indicators!


