

Business View by Area
Business Activity Monitoring (BAM) is Gartner’s term that defines how to provide real-time access to critical business performance indicators to increase the speed and efficiency of operations. It allows you to get the information into multiple application systems as well as in other internal and external sources, allowing a broader and richer view of the business activities. BAM offers subsidies for real-time decision-making based on three pillars:
1. visualization of data or business intelligence
2. system monitoring
3. integration between applications
OpMon, the platform developed by OpServices, can contribute within these three pillars. Examples of its use include logistics, tracking and monitoring of manufacturing processes control, call center management, administrative processes that have an impact on the entire organization, commercial and human resources performance indicators, among several other KPIs monitored in different areas of the company or business verticals.
Any example of BAM must be focused on the benefits of increased process efficiency and better customer service. In the following items, we will show some examples of areas where BAM can be applied, through visual management dashboards:
1. Financial Area
Sales revenue dashboards per-store (gross margin): The speed of the information generated by the visual management dashboards allows CFOs to quickly analyze the financial health of the company from a business point of view and present it with a language accessible to other sectors or members of the strategic board.
In the example below it is possible to analyze the performance of each store, according to financial indicators, such as gross margin (target, true value, deviation from target). The status (displayed in green, yellow and red) of the performance can be verified, according to the values set forth by the management. When the weekly goal is not achieved, for example, the ones in charge receive instant notifications.
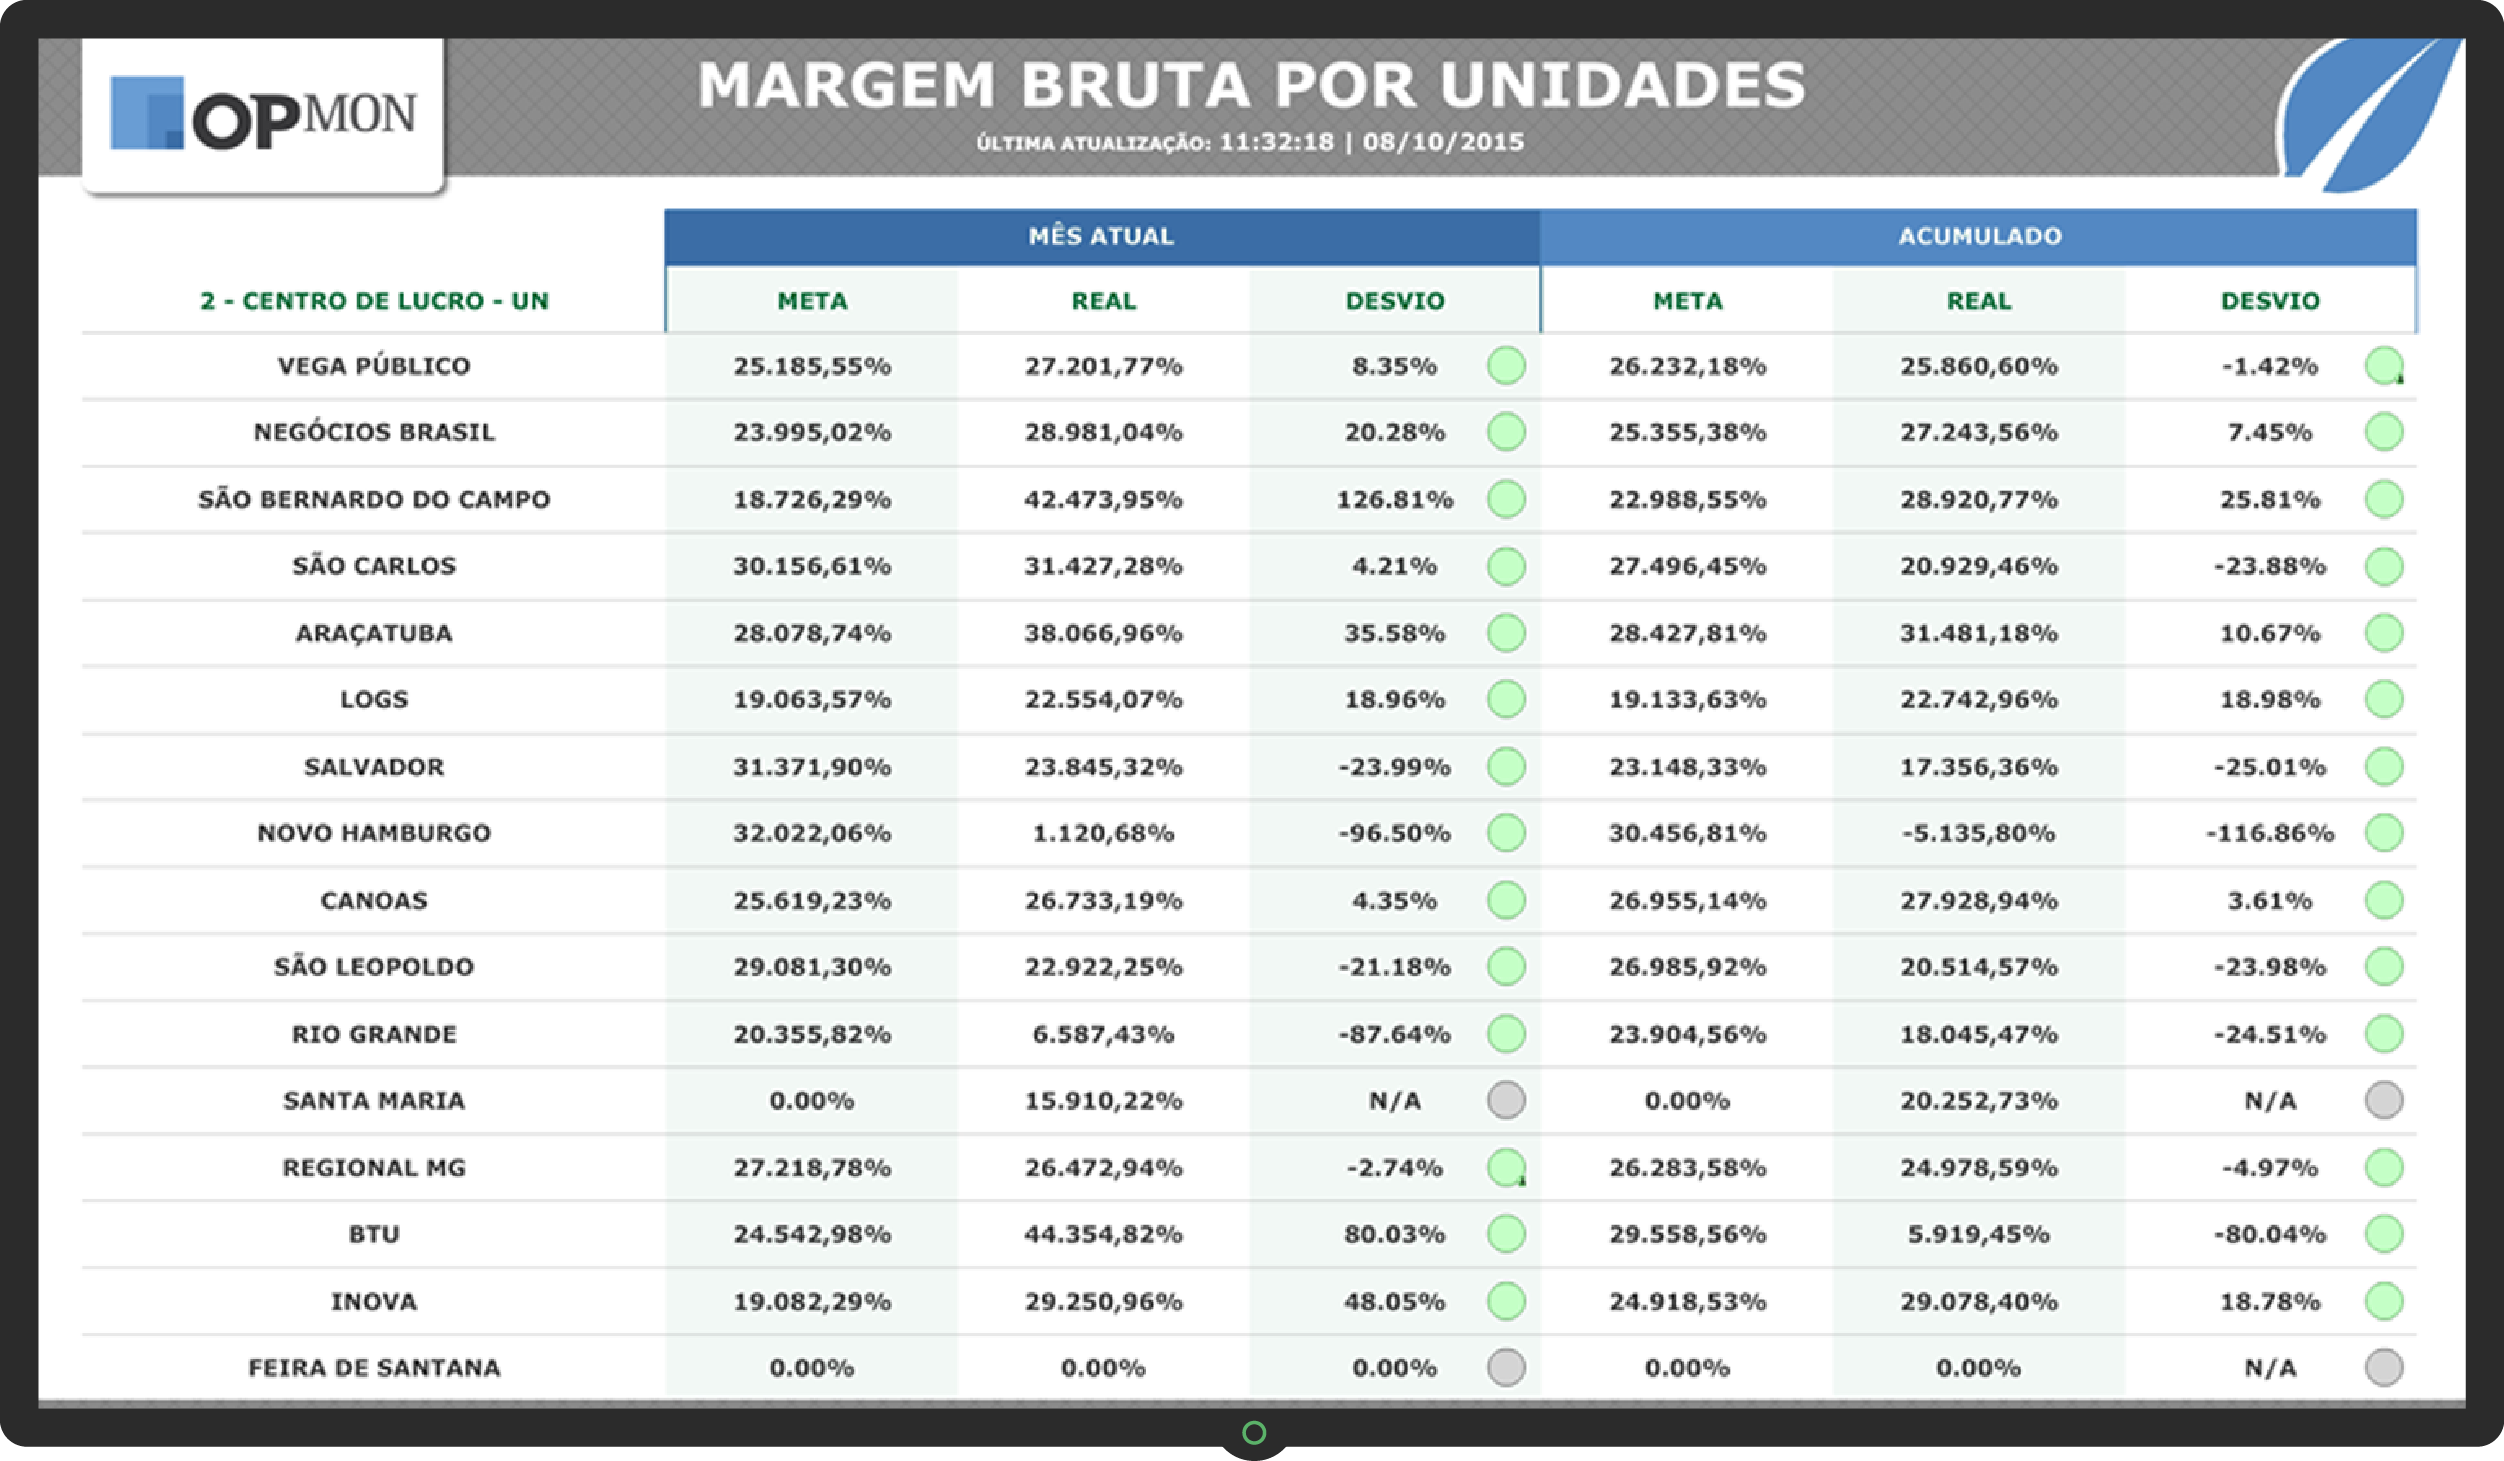
click on the image to enlarge!
2. Logistics Area
Dashboard on delivery status: In many companies, the physical supply chains increasingly have the need for a more “tight” management concerning the reduction of errors and waste, in search for the limits of efficiency. They will benefit a lot from BAM. Business activity monitoring with SCM indicators collection and integration of data from other areas for monitoring the full chain can be decisive for a richer view on any shortcomings or opportunities to seek greater effectiveness.
Getting information on the electronic invoice service, for example, is essential so that a product can be delivered to the purchaser. This dashboard below you can see the situation of the deliveries in real time, like time stopped in the yard, loading time, mileage and several other critical indicators for companies who have logistics as a competitive differentiator or critical activity.
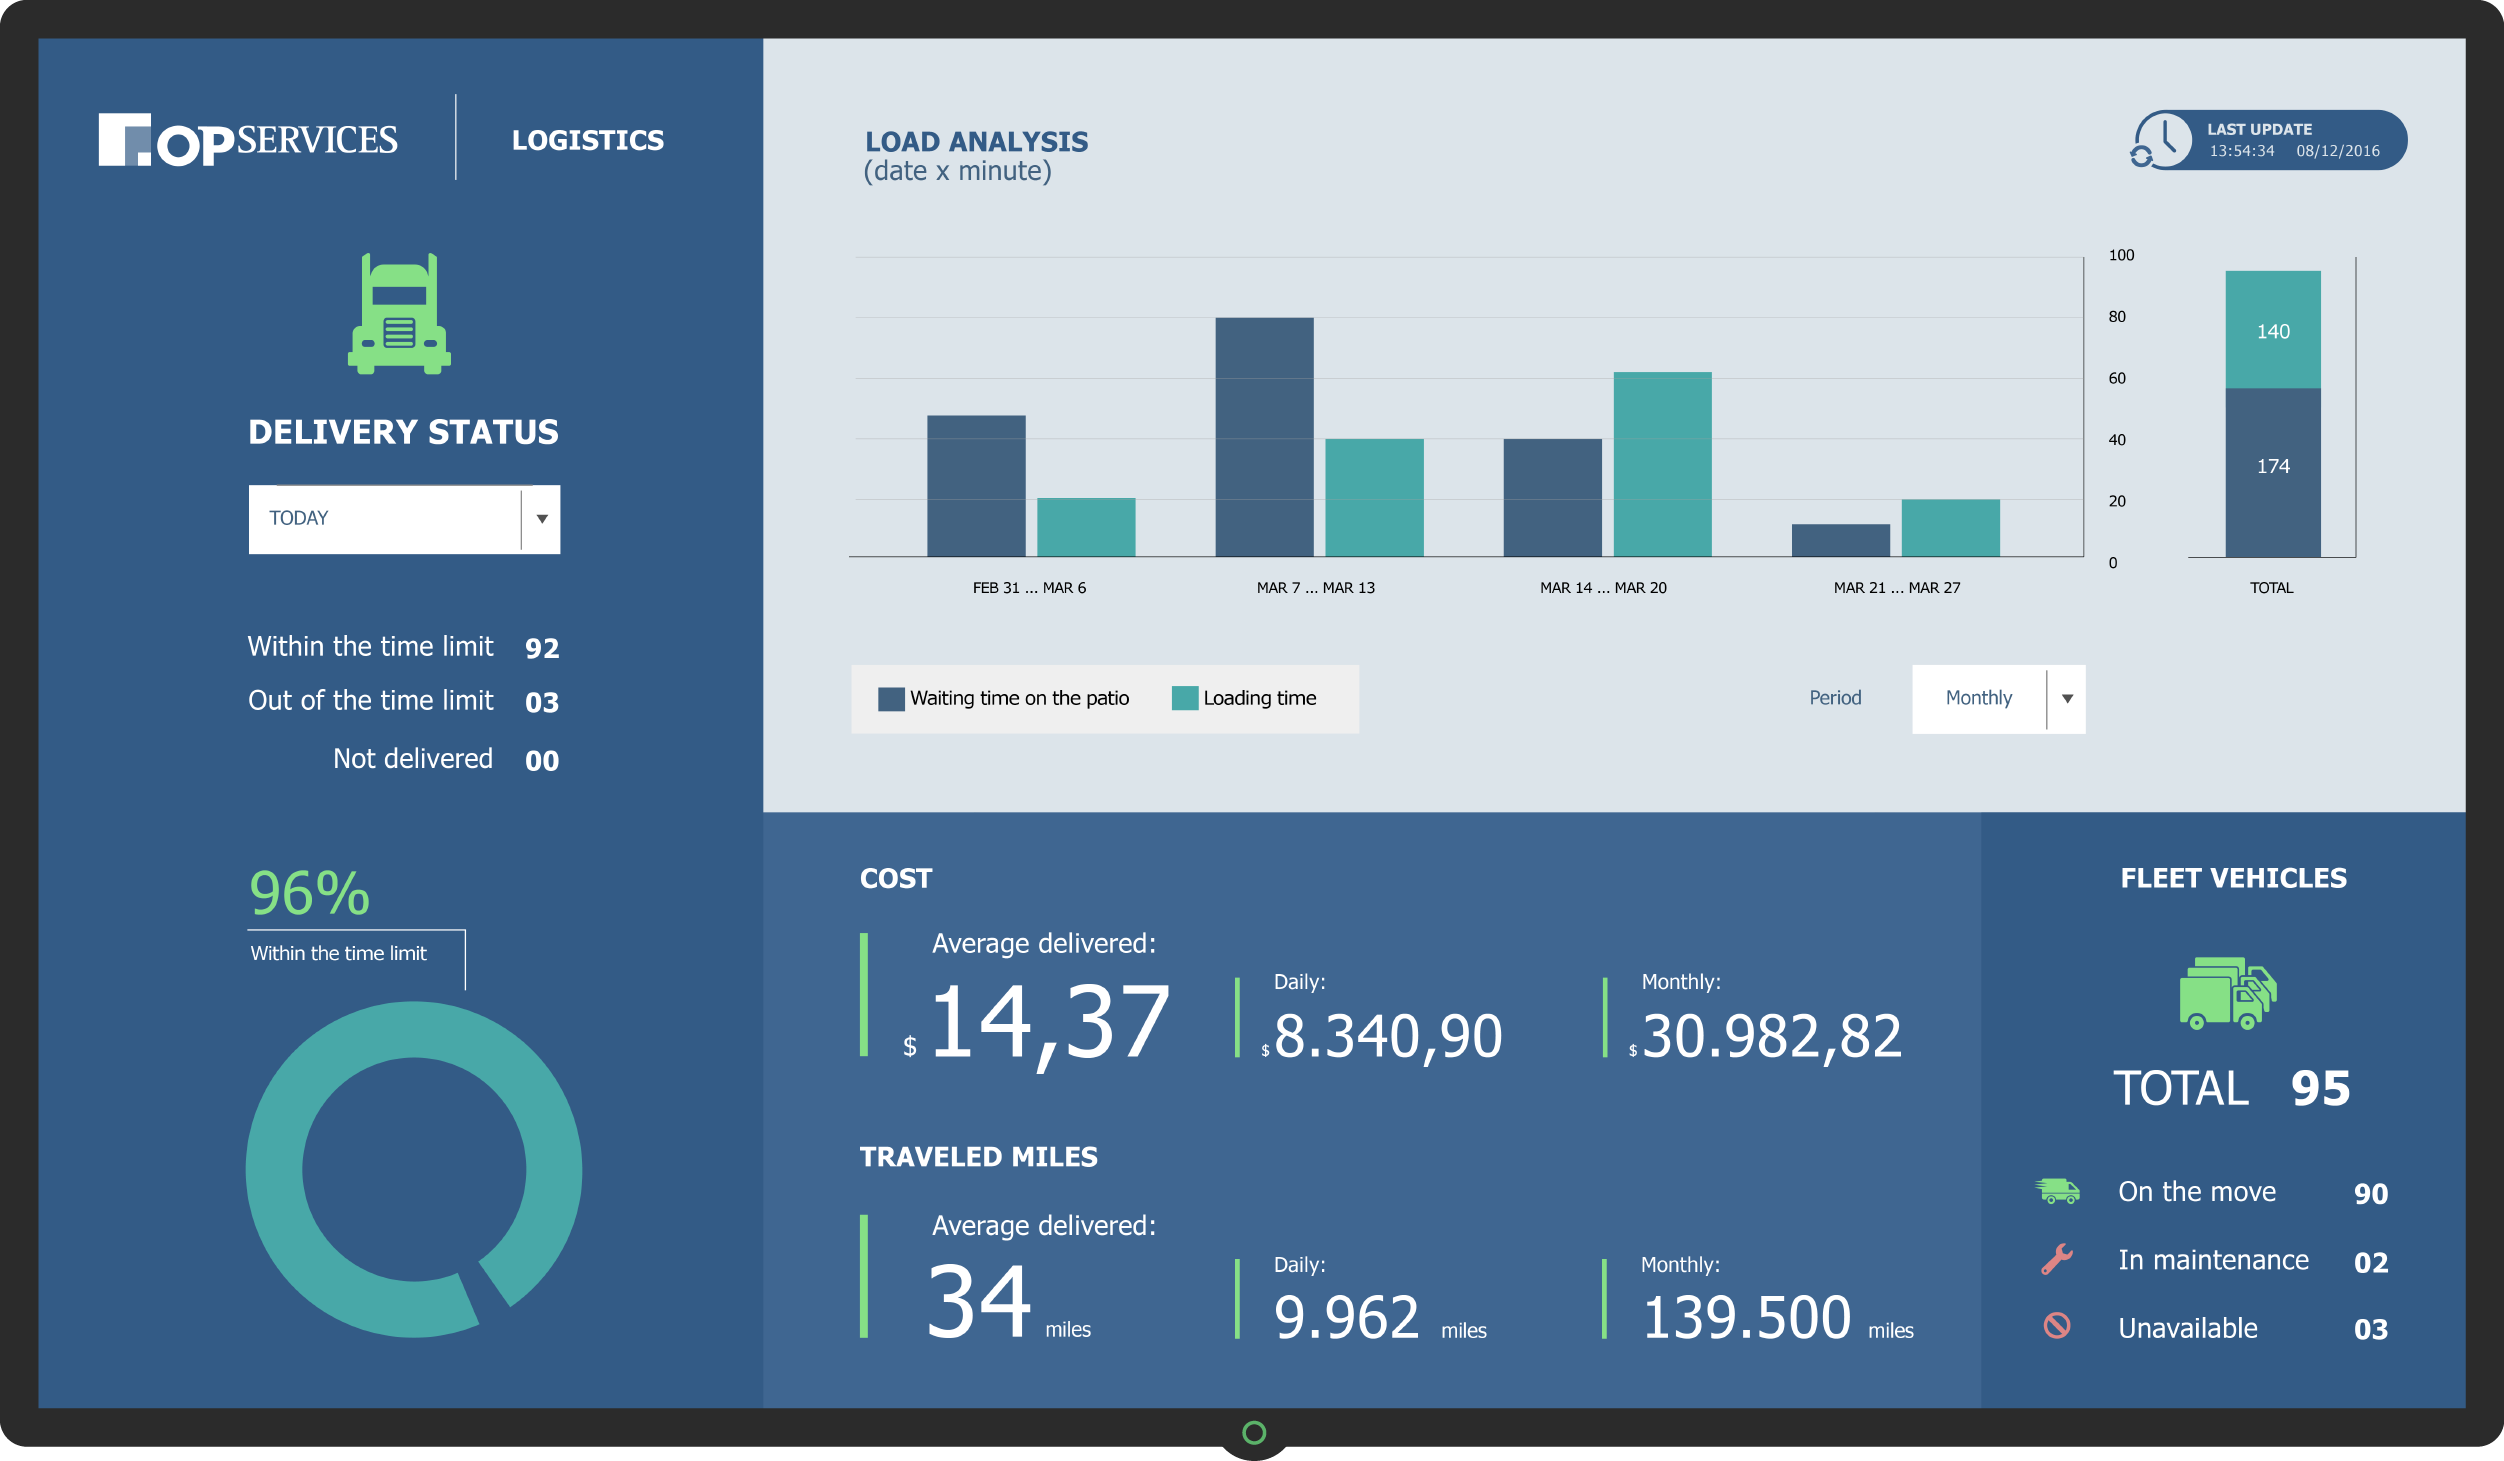
click on the image to enlarge!
3. Commercial Area
Online store sales dashboard x Physical store: The possibility to get information on different systems and present them in a centralized decision-making is a critical factor for the commercial area. Information of CRM sales funnel, sales revenue of physical stores, online sales, number of people who enter each store and pass through sensors, list of best-selling products and various other information may be available in real time for managers.
In the example below, you can see an example created for a client where several business critical information are presented in a visual management dashboard in order to make faster decisions. In case a number is lower than expected, it is possible to configure alarms and notifications via SMS, Email, opening of calls, etc.
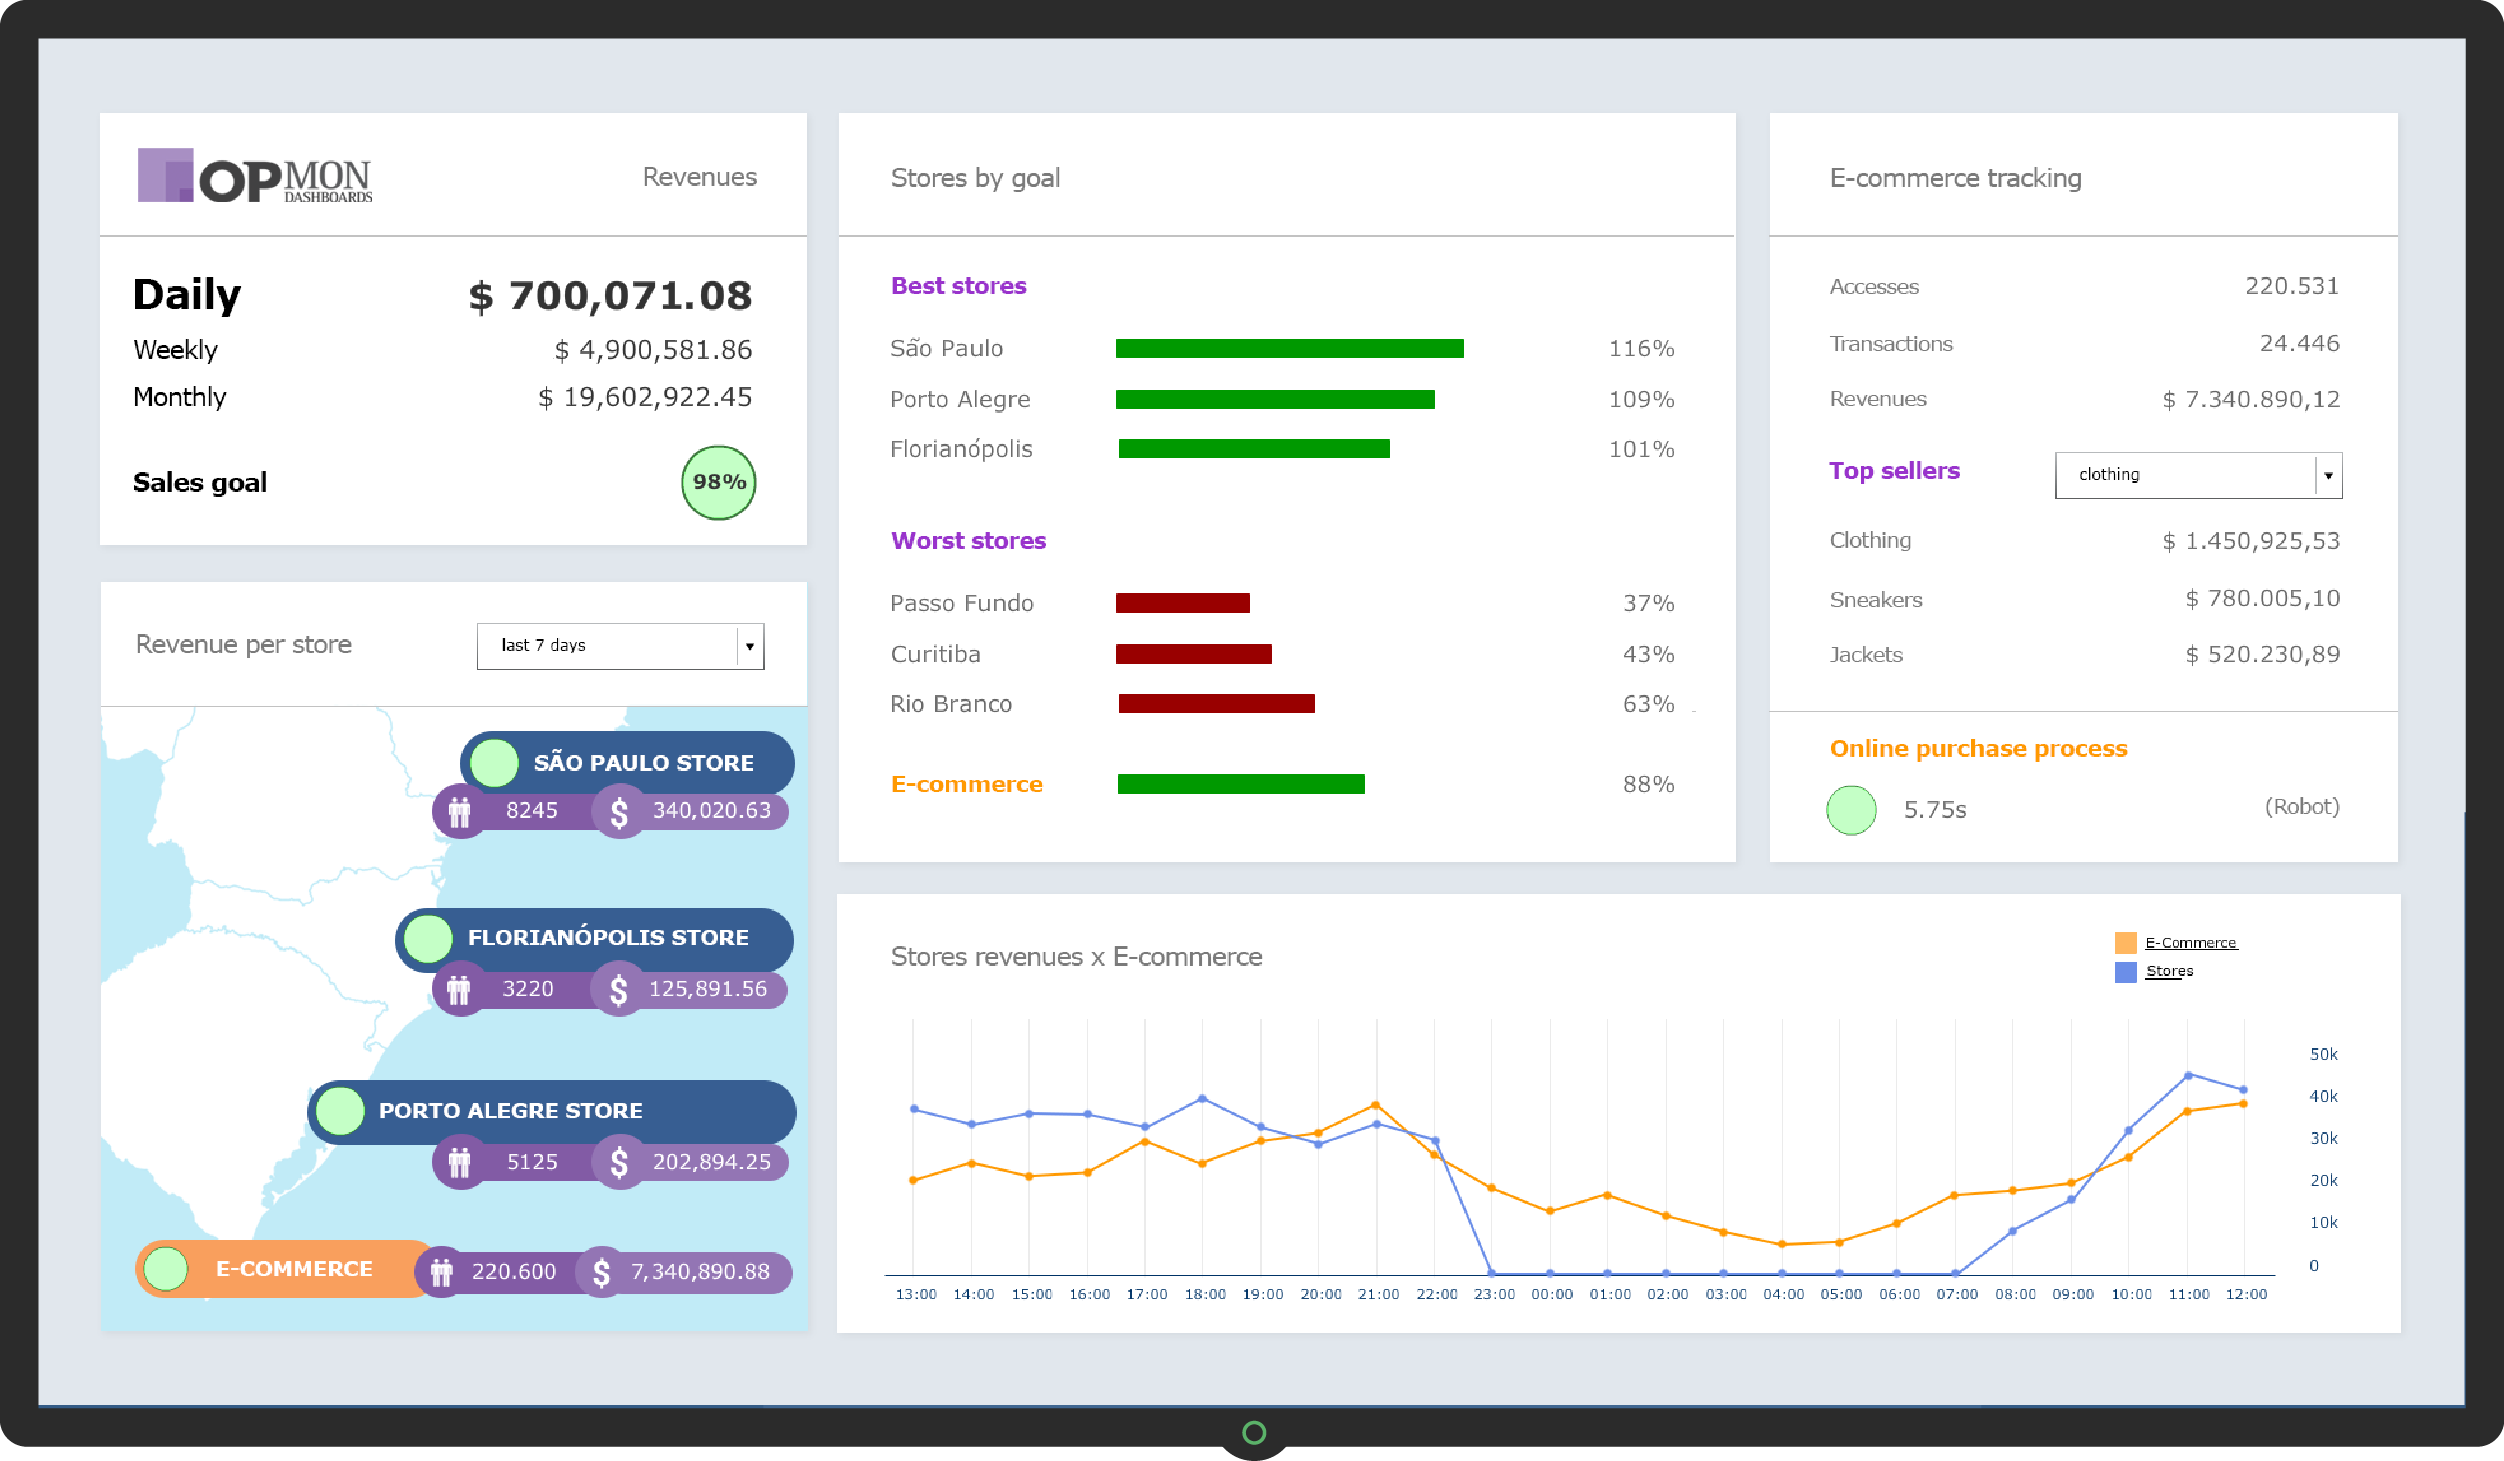
click on the image to enlarge!
4. Human Resources Area
Indicators of HR department dashboard: HR management systems, though often effective in their goals, cannot provide a wide enough view so as to make decisions. Cross-referencing data from calls, with HR software, ERP and financial systems can be a great benefit for the management of the company.
In the dashboard of example below, you can view the amount of holiday, admissions, shutdowns requests, amount of staff by area, investments in human resources, benefits and refunds. A single view can enable a better management of teams throughout the year.
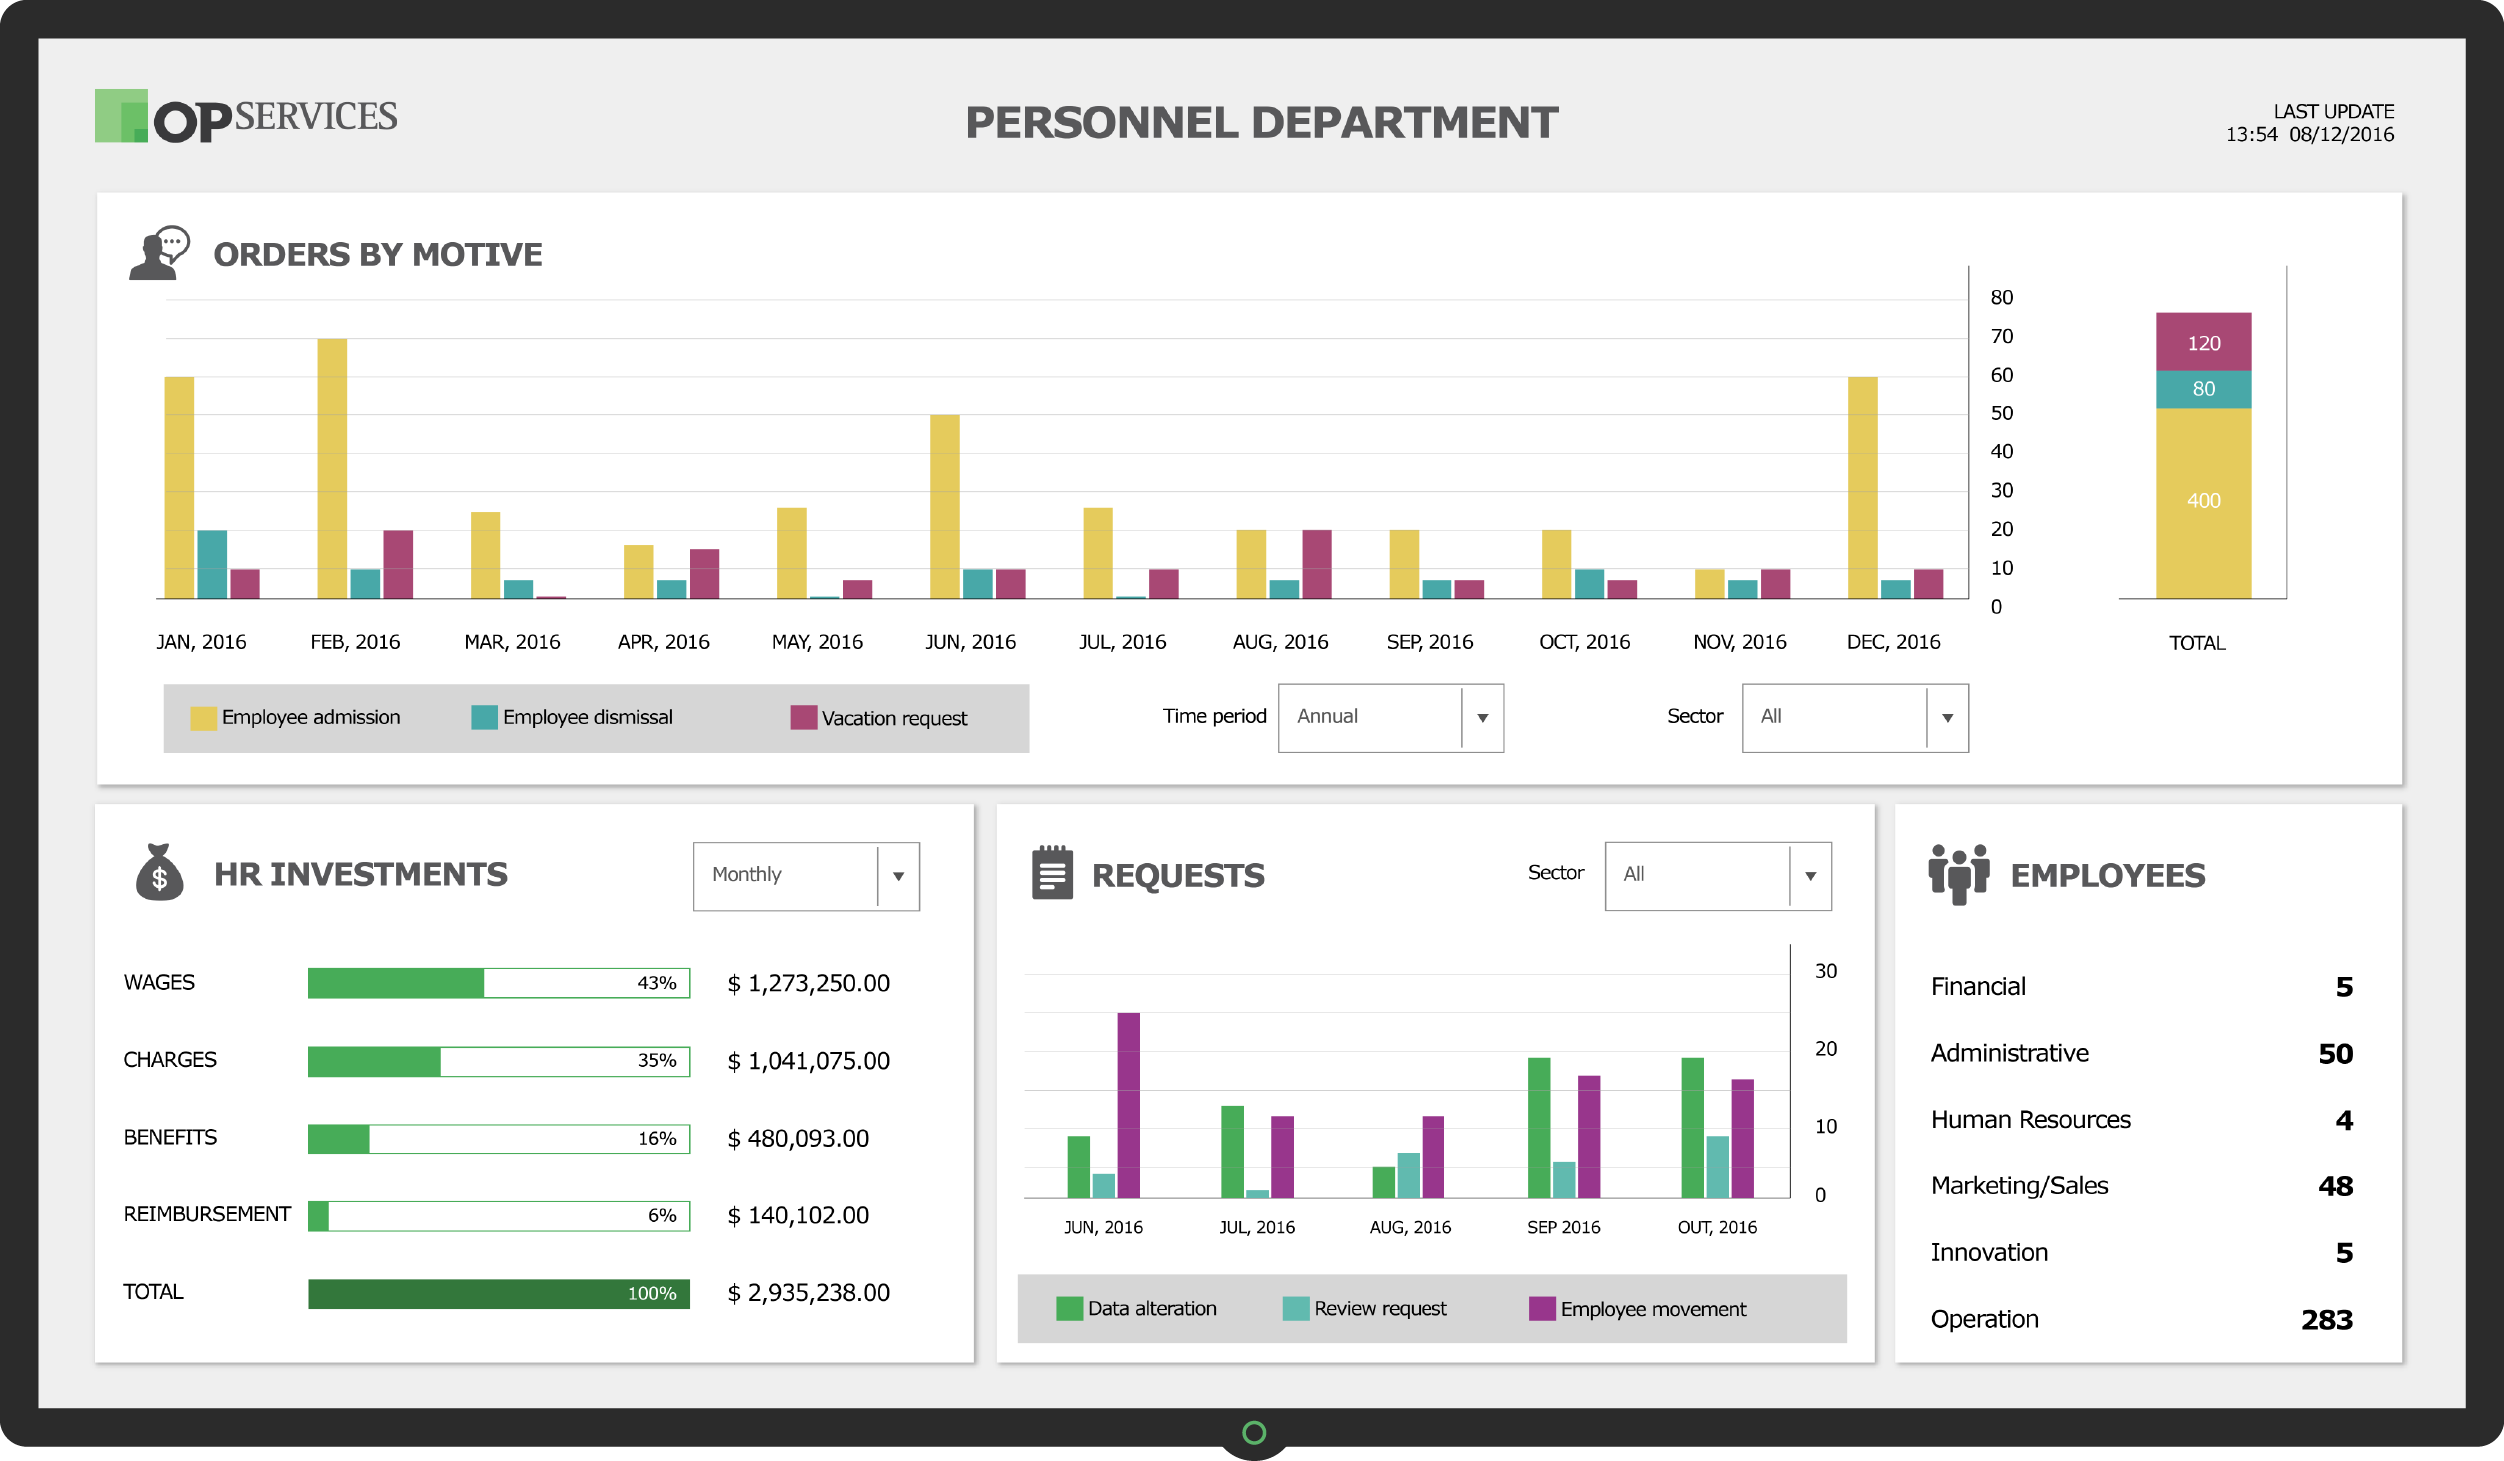
click on the image to enlarge!
5. IT Area
Datacenter Dashboard: The IT area, historically, has always had a lot of information available to support decisions. However, in most cases, never managed to use them to improve the management and align IT to business. The possibilities of dashboards for IT are very large, with performance indicators of the datacenter, internet links, equipment of the IT environment, staff productivity, among others.
The system integration through visual dashboards for management can be a differentiator for an area that has always had to manage an ecosystem with huge tools and is always seen in the company as the “cost” department or the “Emergency”. OpMon visual management dashboards can give a better visibility to the area.
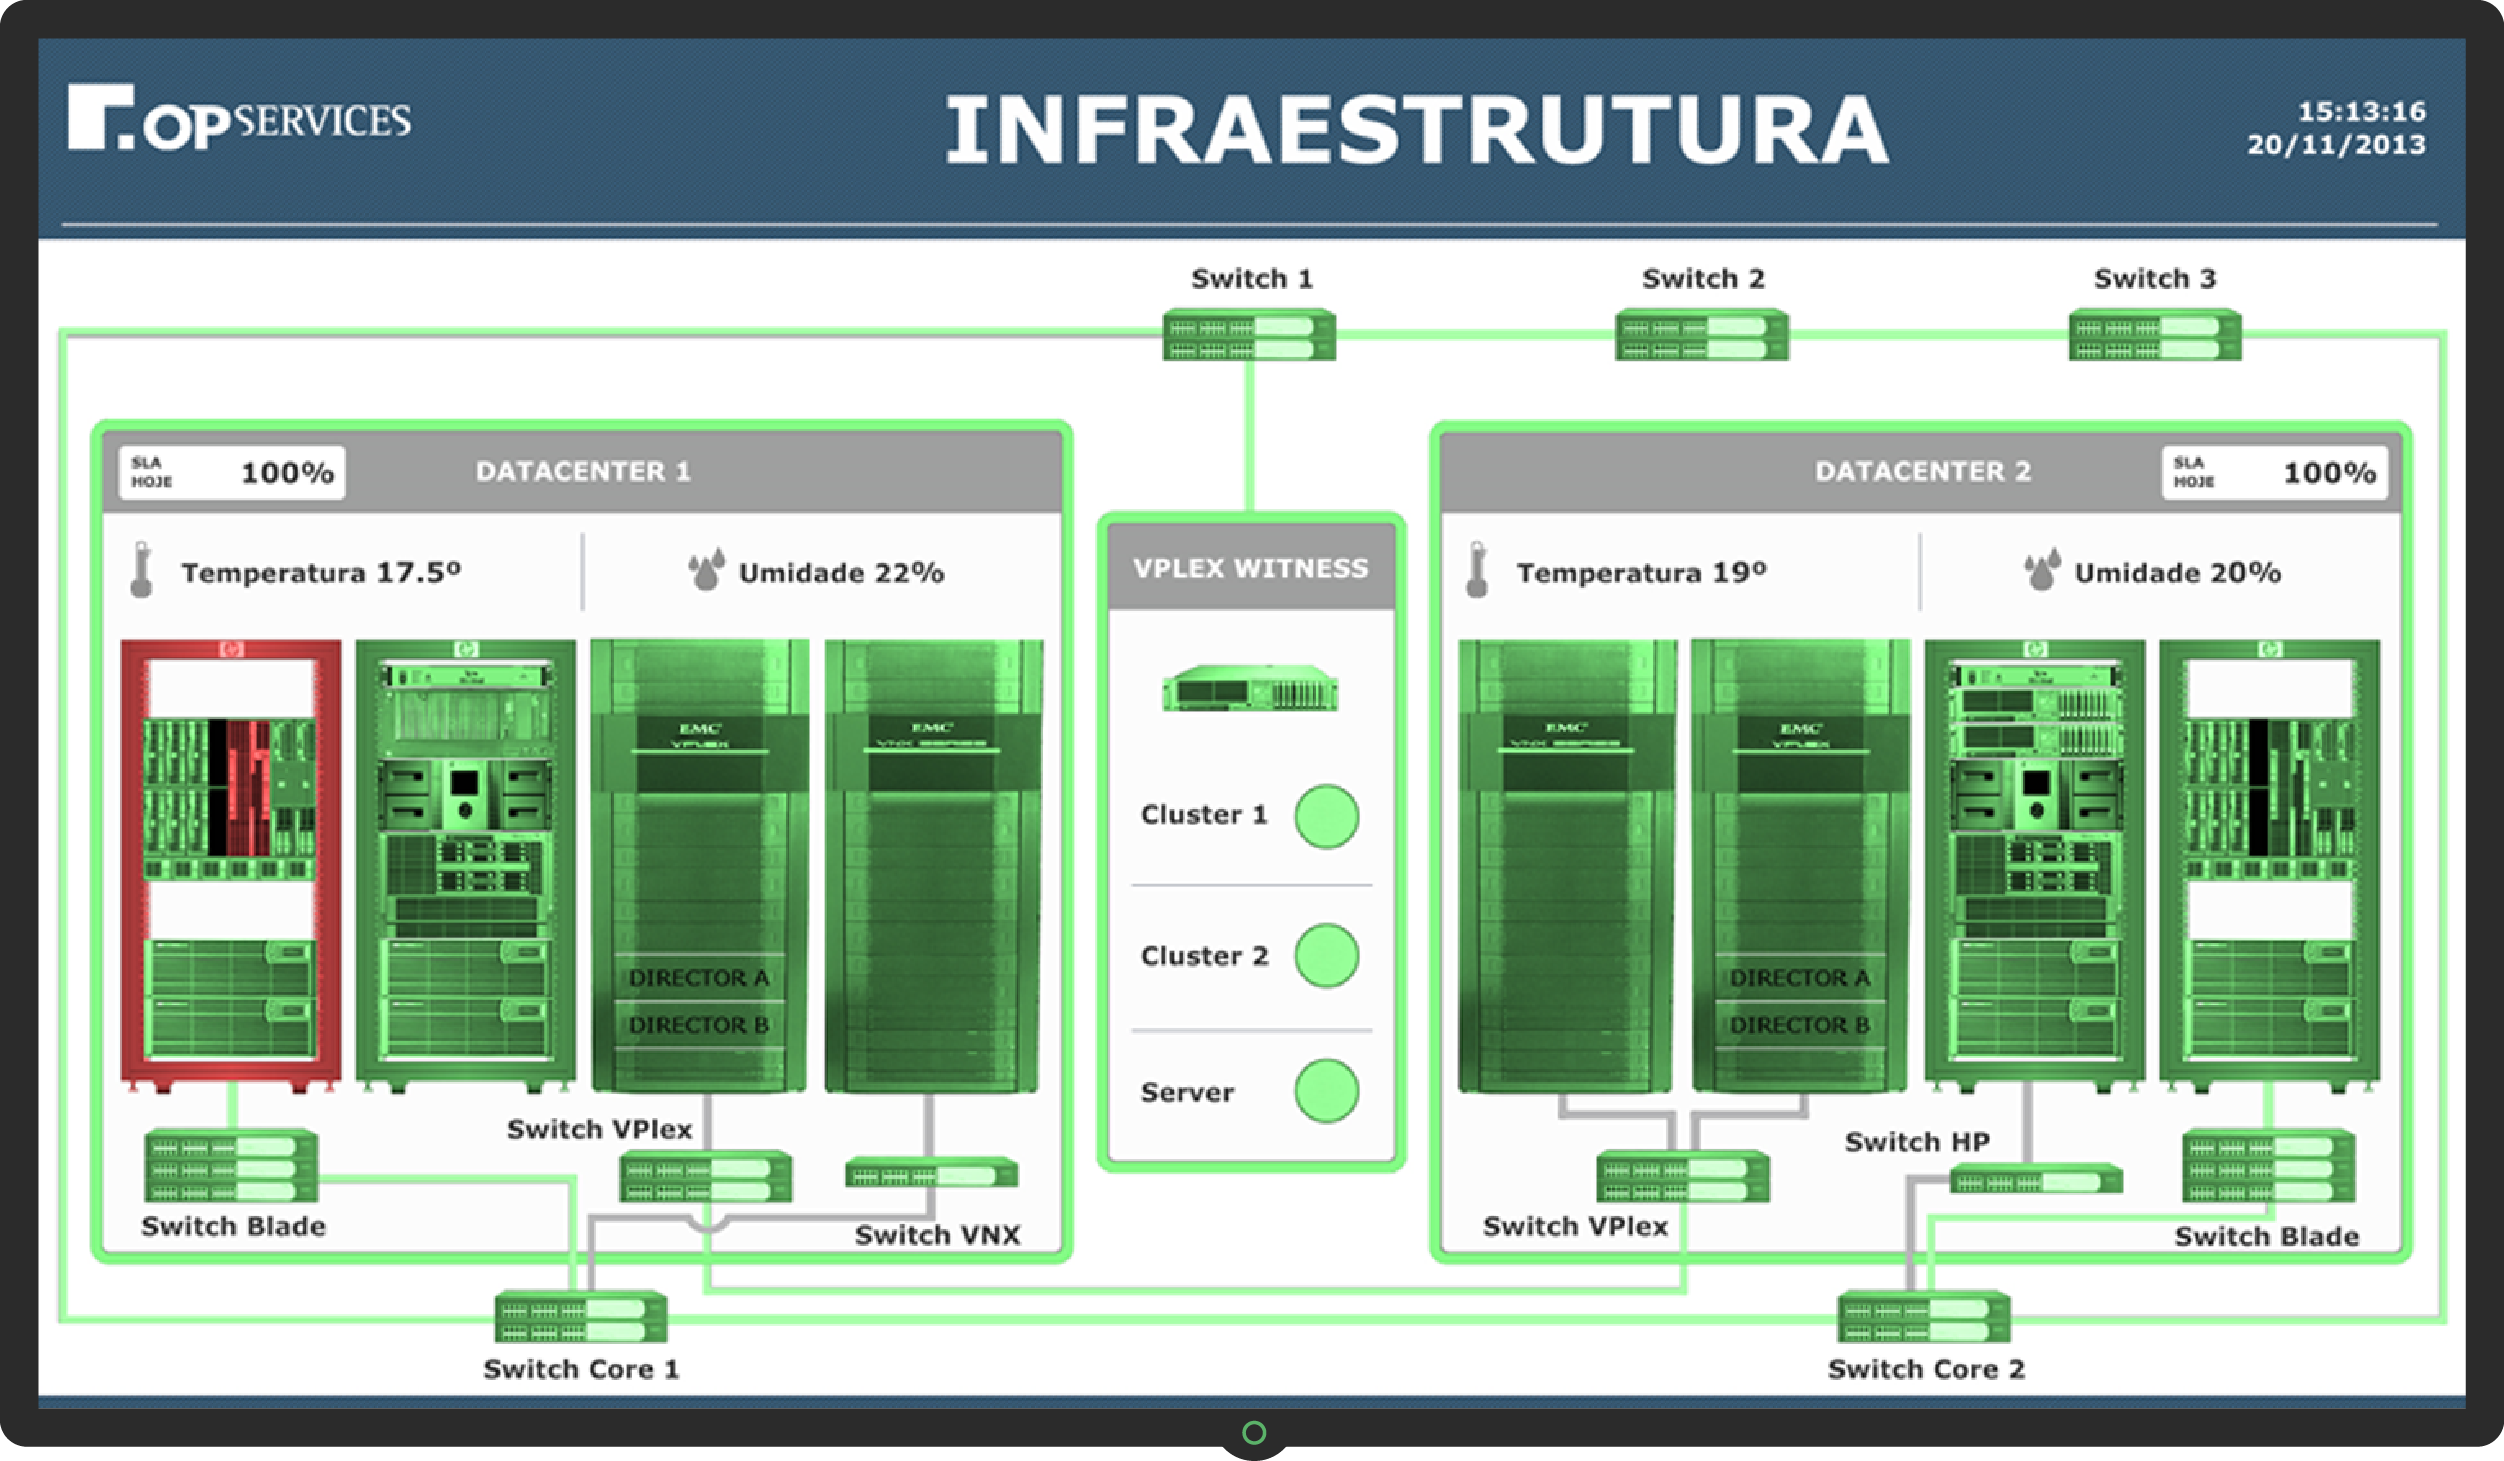
click on the image to enlarge!
6. Systems Area
ERP system (SAP) dashboard: SAP is an integrated business management system that offers numerous collaborative business solutions for companies. By having an architecture composed of a large number of applications, its management is a crucial mission within the IT environment of its users. OpMon dashboards can offer a detailed view of the performance of SAP or of any other ERP.
From this, the system administrators get valuable information to optimize the SAP performance, through the search for problems directly in their root cause. This proactive, automated process eliminates the need for system administrators to perform manual tests and to access several SAP sites to analyze the performance. In addition to SAP, any other system can be monitored in this way.
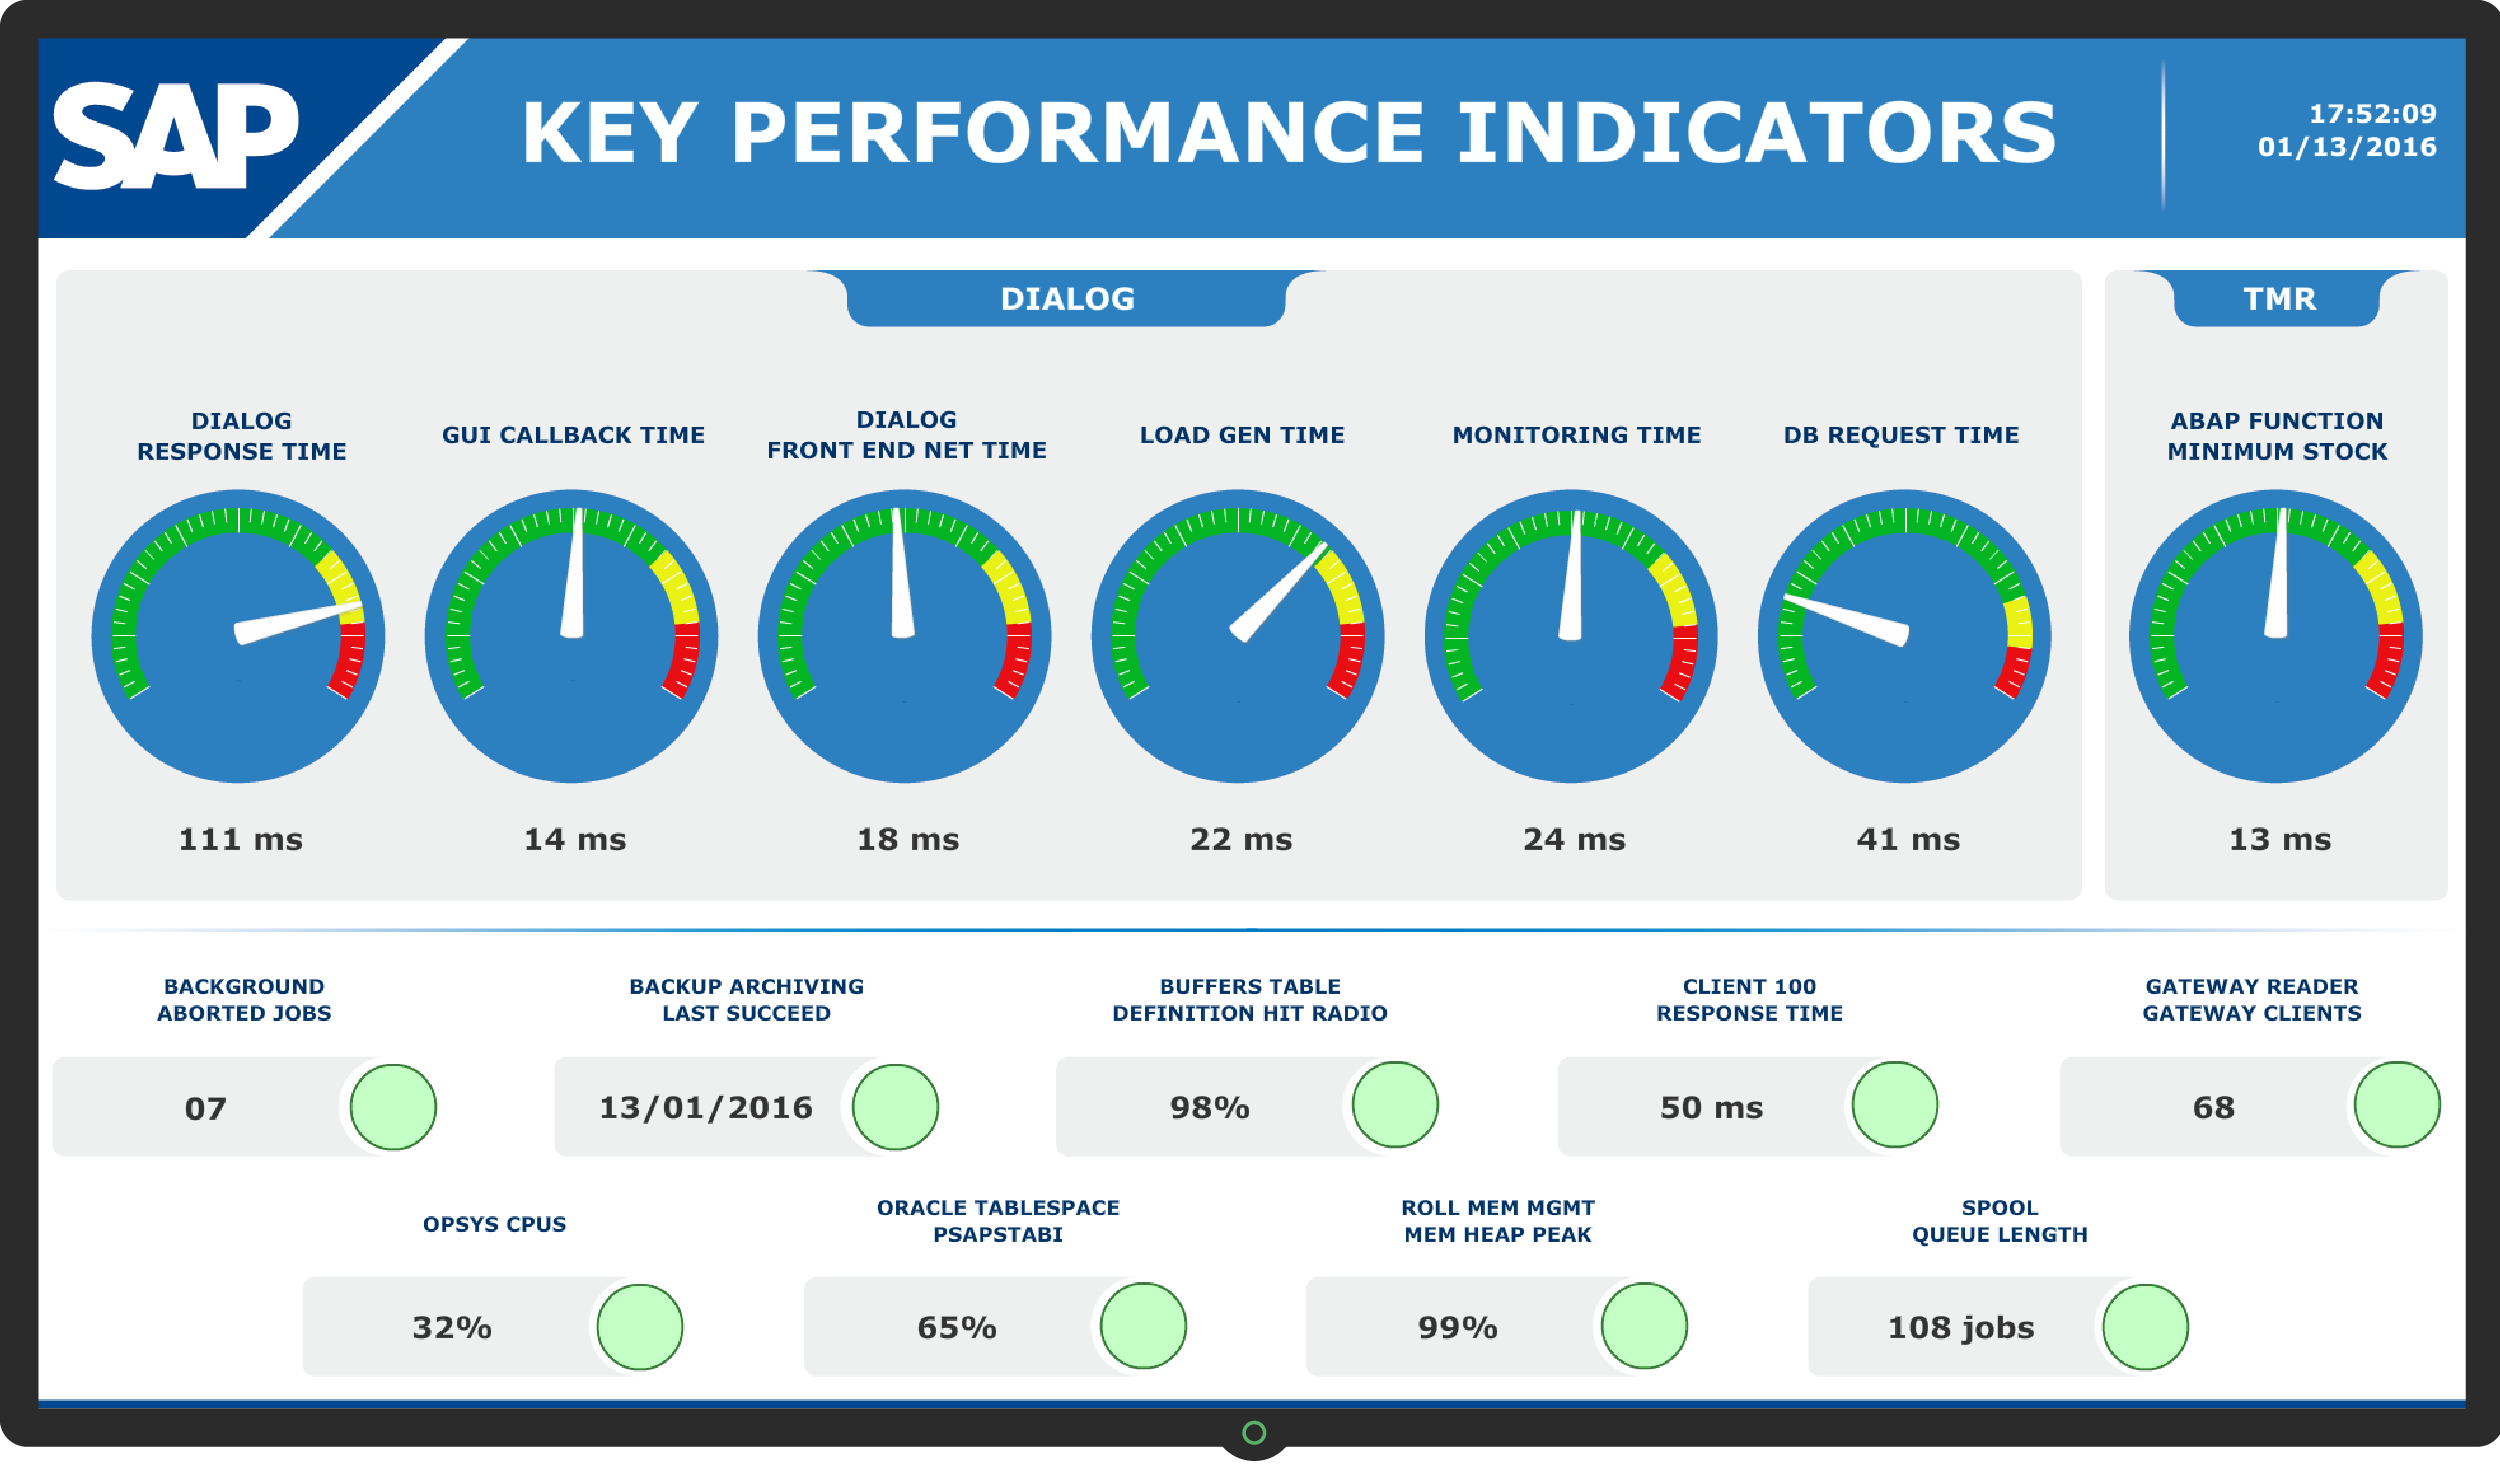
click on the image to enlarge!
7. Operations Area
Support or customer service team dashboard: The management of a customer service team or an internal requests team of a company, through a Service Desk system or HelpDesk, is a complex task. Information on the number of assistances, time of interactions, opened, closed and pending calls and indicators that go beyond the interactions recorded in systems are very much needed.
Viewing data that come from a system that manages calls can be a good starting point for the operations area manager so as to successfully coordinate a team. Check how to accomplish this through an example that is used internally at OpServices, where we monitor our team in real time.
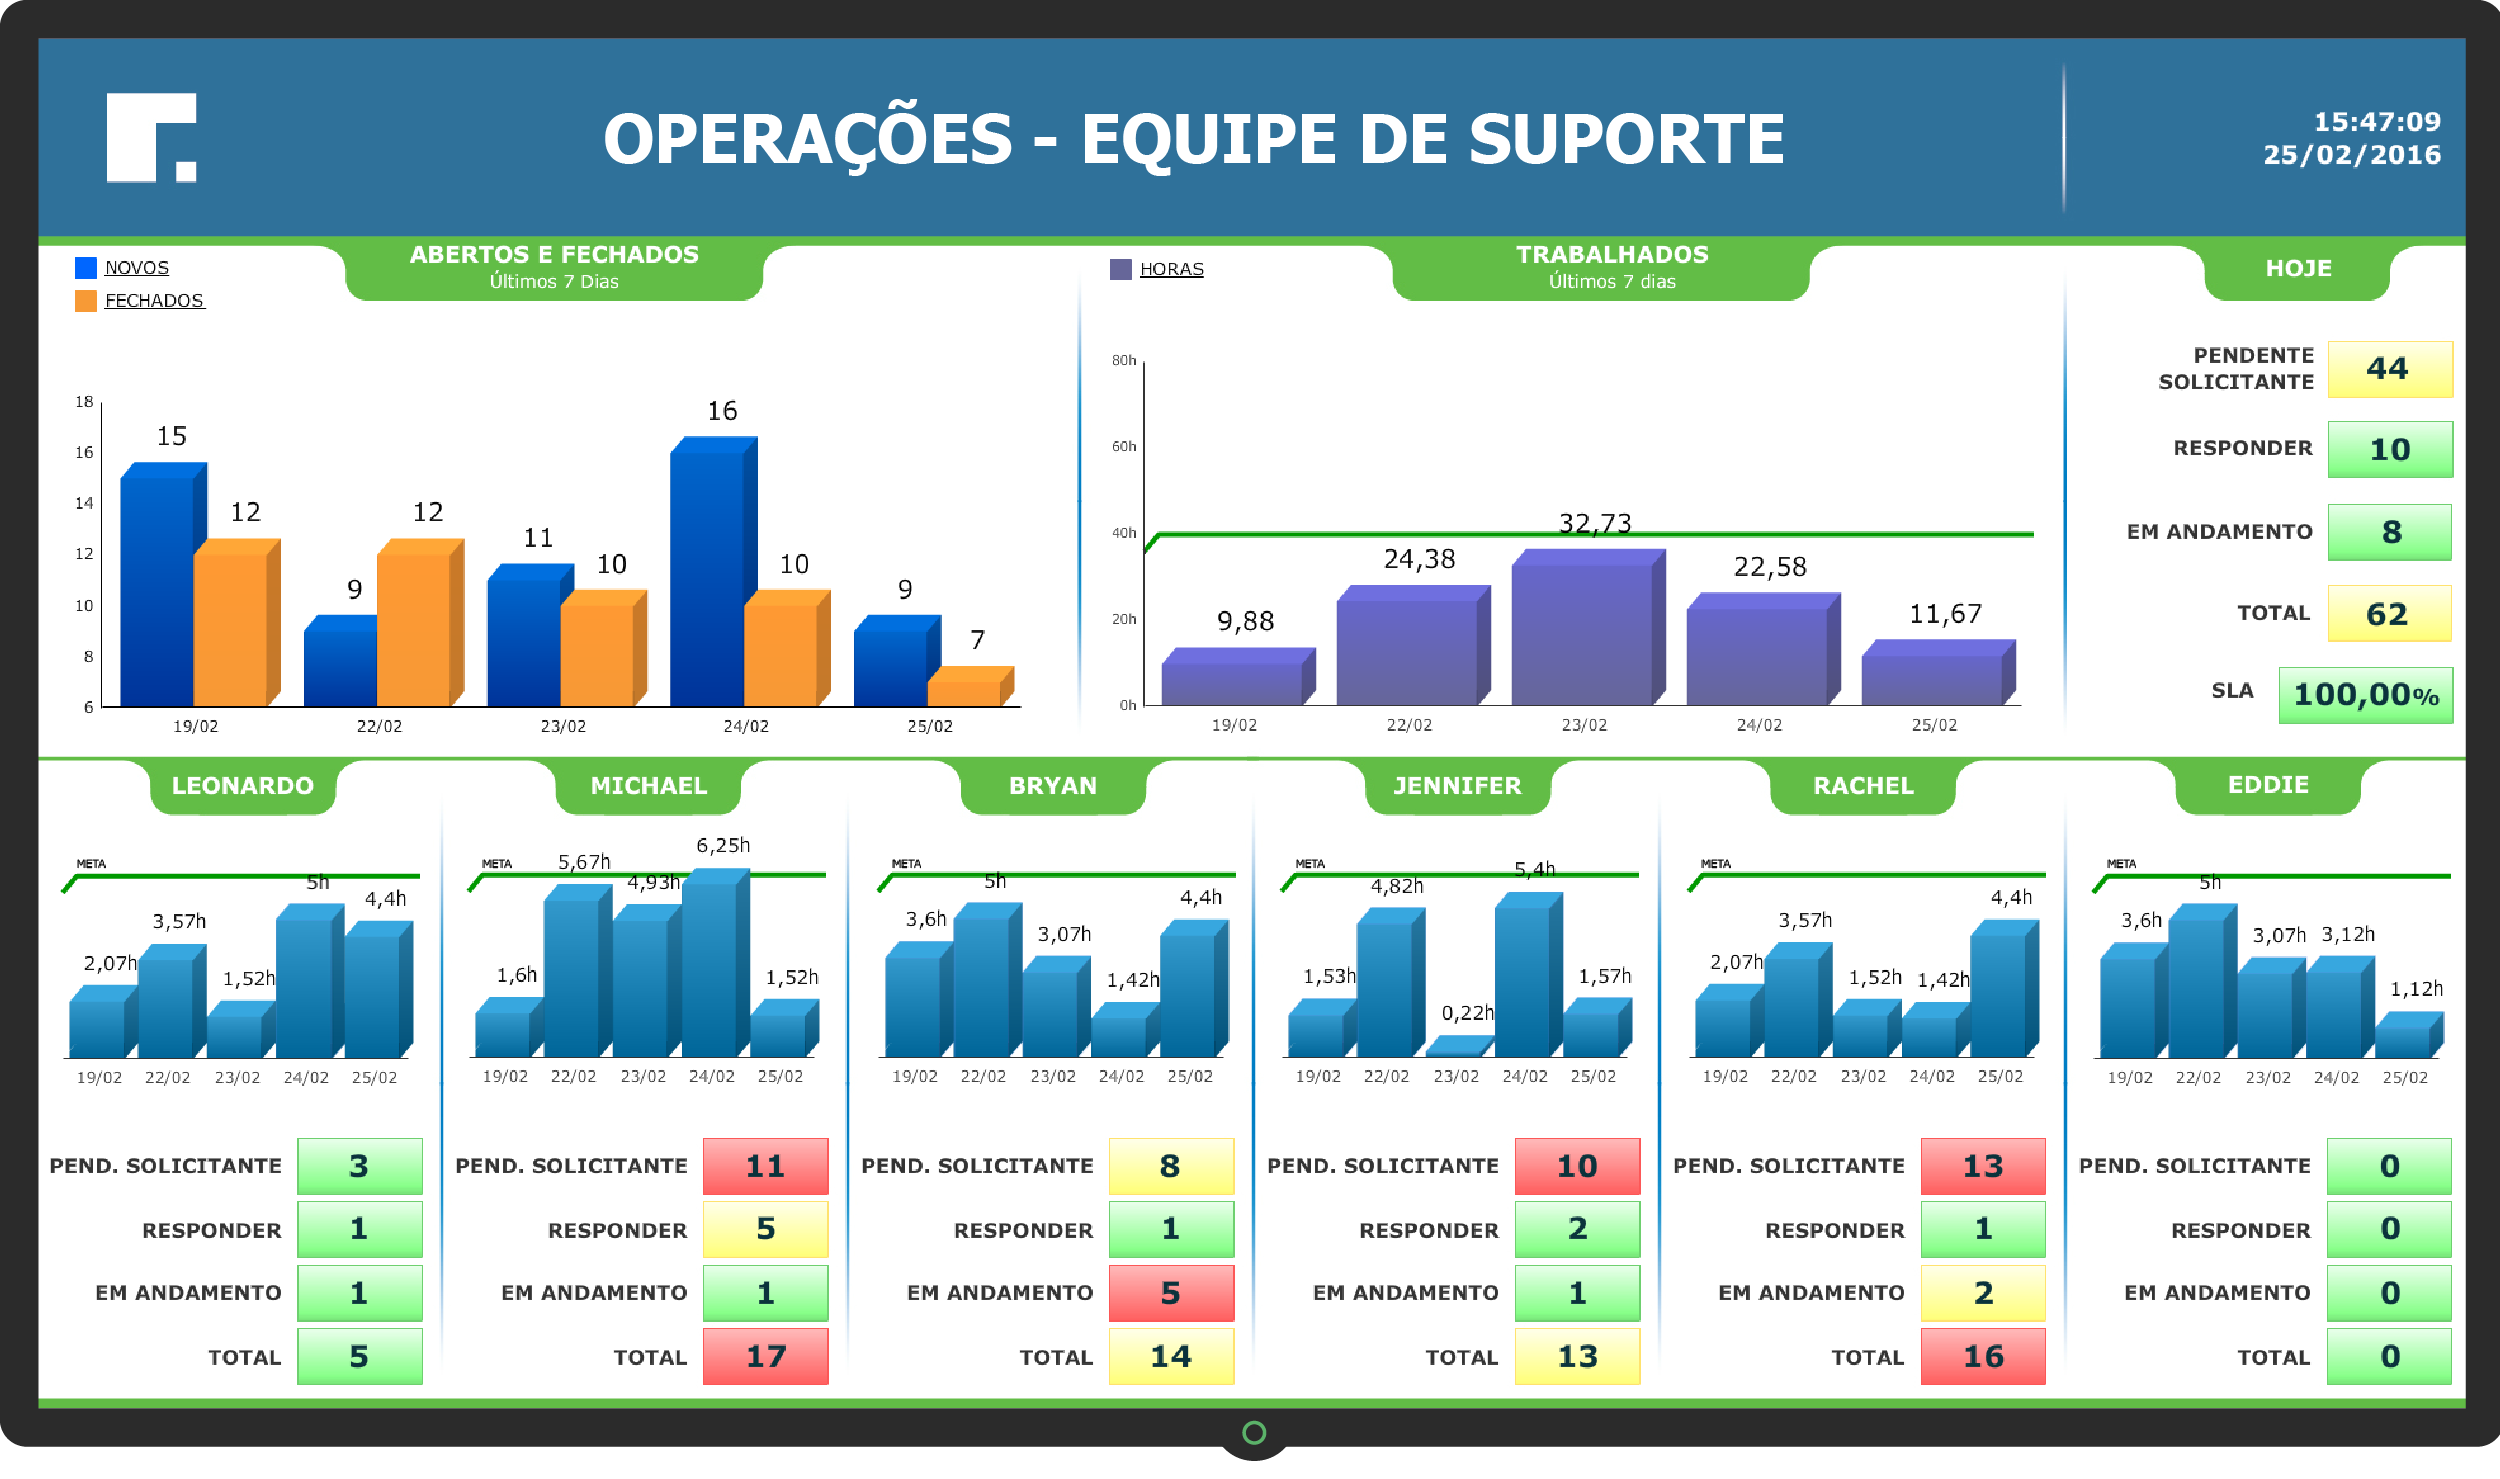
click on the image to enlarge!
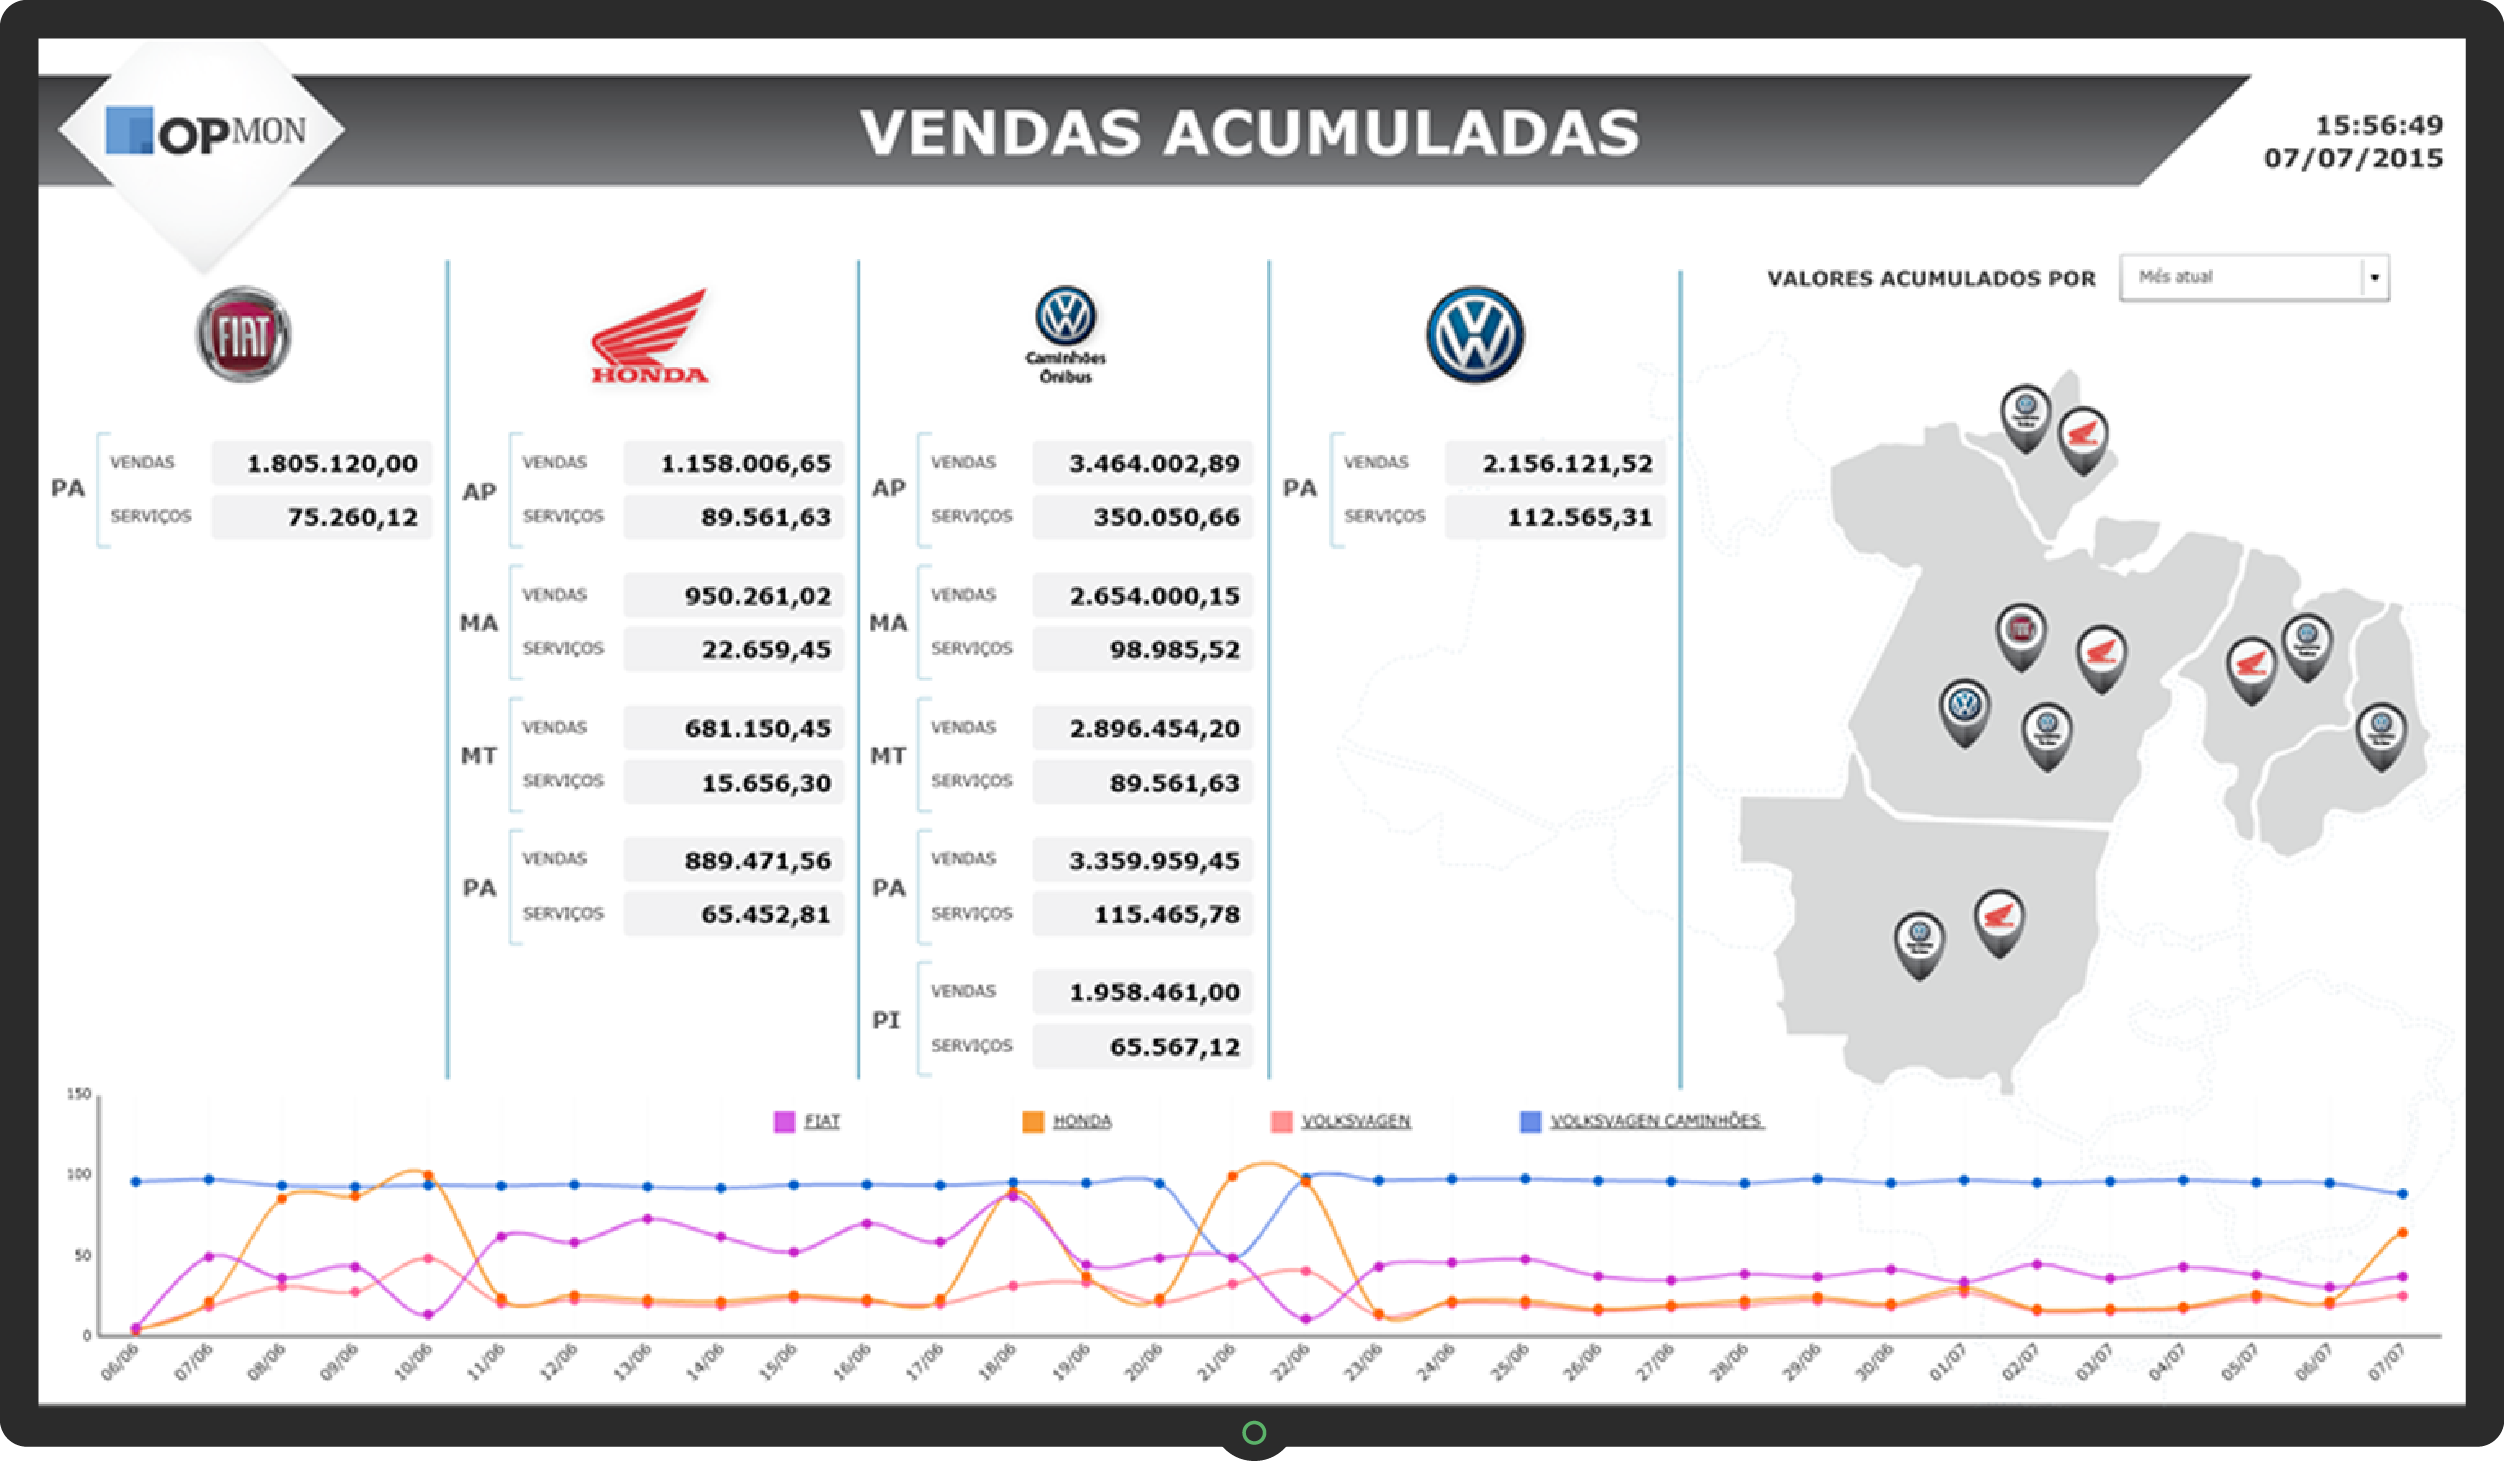
Analytical dashboard of sales per unit: Knowing which units sell more or which are the most profitable products can be a decisive factor to make strategic decisions that will improve the operations of the sales and marketing area. In addition to searching data from the past, it is possible to view sales in real time to know, for example, if a product campaign is being effective. The dashboard view + business behavioral monitoring resource allows the use of tools that determine, upon analysis of the history, an expected behavior . If this expected behavior is not reached, it generates alerts and notifications. Besides these examples, there are many possibilities for the business activity monitoring and all areas can benefit from this technology. The visual management’s objective, besides providing resources for decision making processes, is to generate data in real time, making it possible to solve problems when they happen. click on the image to enlarge! BAM – Business Activity Monitoring
Besides these examples, there are many possibilities for the business activity monitoring and all areas can benefit from this technology. The visual management’s objective, besides providing resources for decision making processes, is to generate data in real time, making it possible to solve problems when they happen.Related Posts
Visual Management and real-time business processes monitoring
The death of the excel spreadsheet to manage indicators!


