

The competitiveness of the market today requires that each investment is justified and measured, since having information about the business allows you to pursue the strategies and the competitive advantages for companies. However, not all areas of an organization can perform this measurement, especially IT and I&O. And to assist in this problem the concept of IOBVD (Infrastructure and Operations Business Value Dashboards) has been created.
“Until 2020, half of the companies that have their business based on infrastructure adopted Business Value Dashboards”. Gartner
If you’re a Manager, it is very likely that soon you will apply this concept on the daily routine of your business through several emerging technologies. Understand now what IOBVD is and how it is applied in organizations to improve the visibility and impact on operations.
IOBVD – Infrastructure & Operations Business Value Dashboards
One of the greatest challenges of the IT and I&O (Infrastructure and Operations) leaders is to report the value that their areas are generating for the organization, based on strategic and financial metrics. Generally, the IT and I&O areas have only operational metrics available, such as availability of applications and average time to resolution of callings. However, they can’t raise the indicators to a more strategic level within the macro setting.
This task becomes extremely necessary since, historically, these data are reported to the CFO’s of the company, i.e., executives who are used to dealing with finance and financial data. This unfavorable scenario creates a wrong perception that IT and operations are only cost centers, often resulting in budget cuts.
In order to change this misperception, the concept of IOBVD has been created.
What is IOBVD?
Gartner, a leading global provider of research and analysis in the area of technology introduced the concept, based on the also recent concept of BVD (Business Value Dashboards).
Unlike traditional systems used by IT and I&O professionals and I&O, that focus only on displaying operational results, the IOBVD can cross this information with financial, commercial and logistic data, as well as with data from different areas and present a result indicating, for example, what was the impact on the revenues generated by the unavailability of a particular application. Or, in a sales-oriented view, from a drop in online sales results, be able to find out if the root cause of this problem is in the decrease in demand or if it originates from a problem in the operation or IT infrastructure.
Connecting the company’s key indicators, it is possible to achieve a more mature and relevant level of analysis of the areas of IT and operations. The approach begins to change typical metrics such as Service-level Agreements or Downtime for a broader view as comply with SLA’s in business and the impact of downtime on the company’s revenue. That is, the area of technology and operations still stands, but should justify their impacts in the area of business.
Business results
The integration of operational metrics with the business areas, promoted by IOBVD, allows managers to have real visibility about the contributions of IT and I&O for the business. Thus, these areas begin to take a more tactical position within the organization, improving the participation of managers in decision making, in addition to receiving more investment, both in processes and in people, such as in technology to automate critical activities to the core business of the organization.
The integration of all applications, as well as infrastructure, operations and business, is a challenge for organizations to show valuable dashboards.
Having visibility of the processes is essential for any company and the dashboards are excellent tools to assist on it. Following this concept of viewing data from a centralized view with indicators of different areas, we suggest reading the article called dashboards of key performance indicators by area of the company.
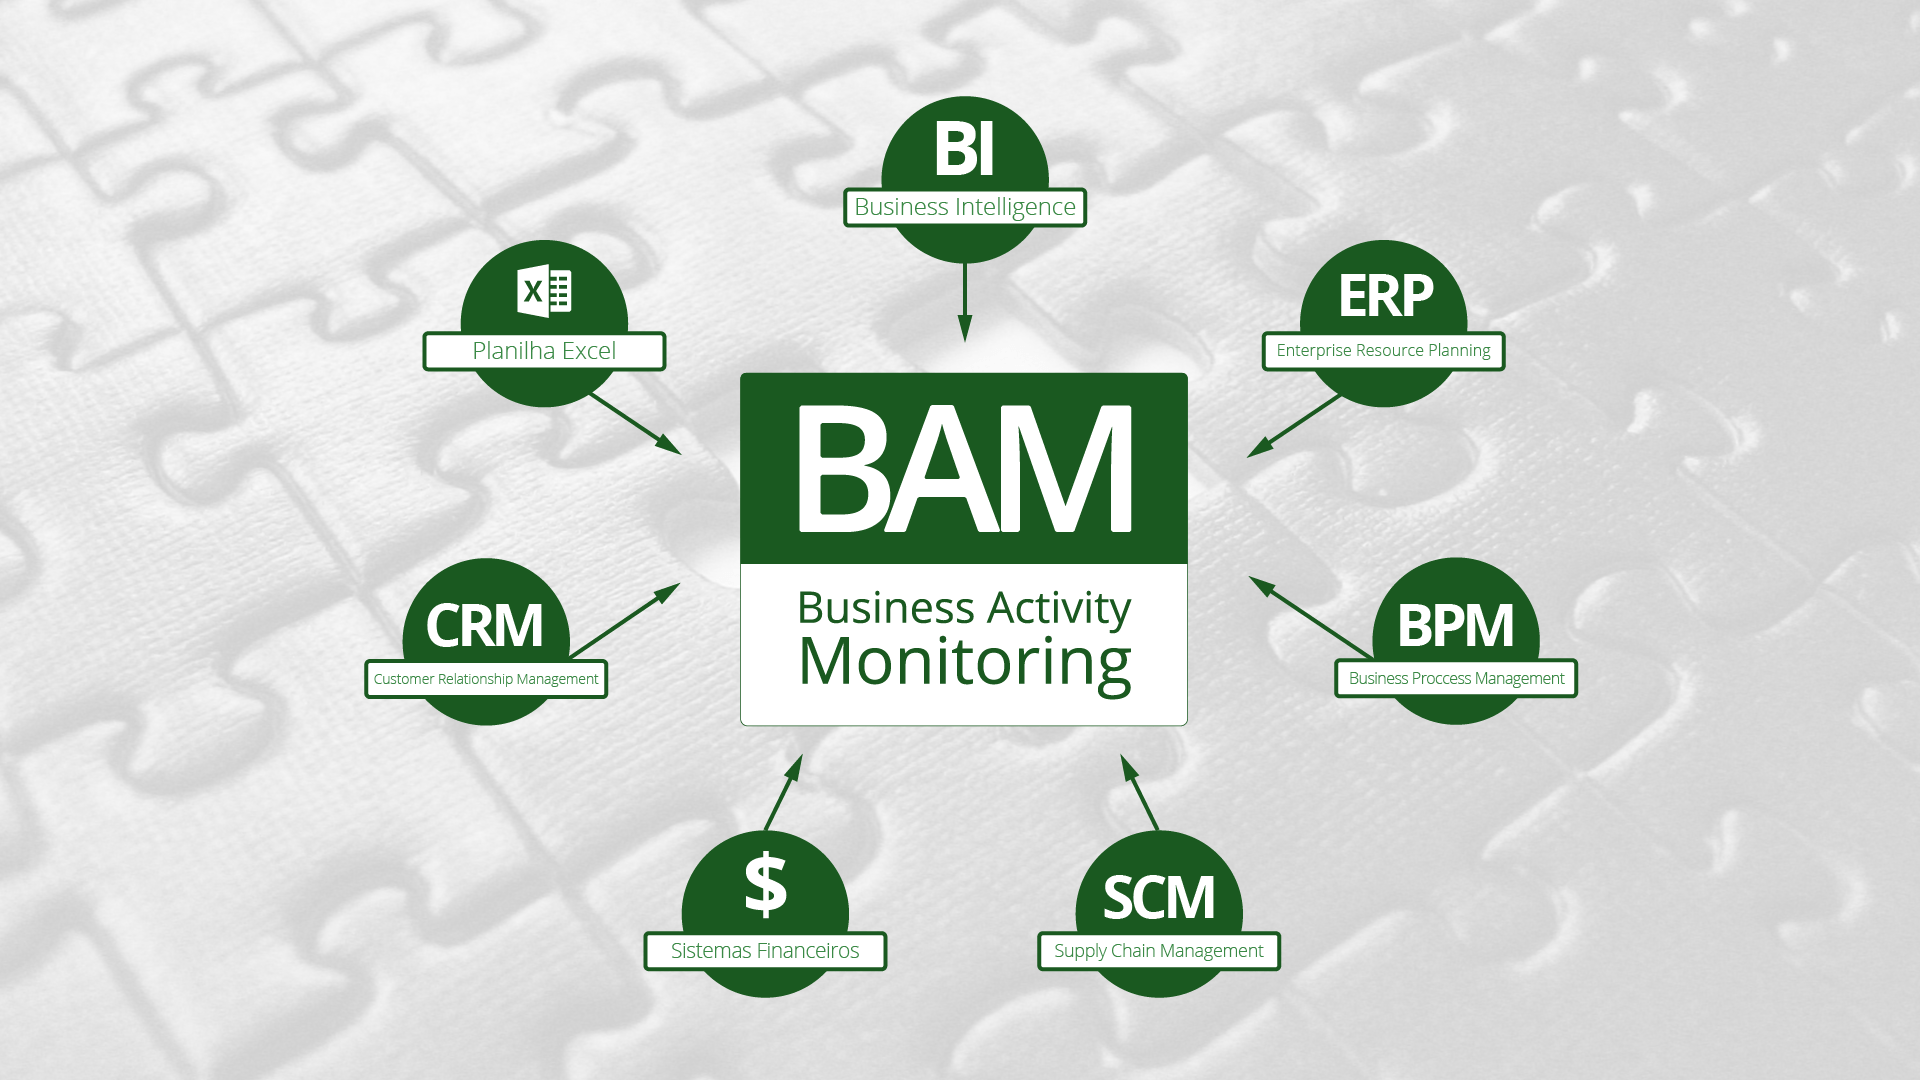
Another recommended reading is the natural extension of the IOBVD, which is the Business Activity Monitoring, the total control of metrics from all areas of management performance indicators in real time: integrating applications, monitoring networks and systems and applying all this to business intelligence.