
Dashboards to improve decision-making
The performance evaluation of technology and business area, in addition to the creation of new strategies to ensure competitiveness in the IT market depend on valuable information that companies can extract from their information systems. This information can be presented in different ways according to the focus of the tool that you use, whether being a management solution for IT environments and infrastructure, through dashboards, which allow real-time management, whether being a Business Intelligence (BI), which allows the visualization of data that are consolidated every day.

The interest in investments in this type of technology lies in the necessity of basing decisions on data and facts, leaving the feeling for other times, where it is impossible to measure what is intended. To illustrate an enormous amount of data that is collected, generated and stored, companies can have control dashboards, which are very efficient tools when the intent is to have a global view of the business and make the decision immediately. Do you want to understand a little more about the importance of dashboards for businesses? Then keep an eye on our article!
Organized information allows for faster analyses
Companies are a huge range of data and information to customers, suppliers, and market solutions as a whole. Keeping this information organized so that they can contribute to the increased performance of the company requires the use of strategic tools. One of them is the dashboard, a centralized view which concentrates the most important data to facilitate decision-making.
Through a dashboard, companies can show strategic data in a few seconds, sort them so that they make sense for the whole team and turn them into sources of insights for business generation. The key issue is that, for this process to work, it is necessary to use a tool that collects these data proactively. At OpServices, OpMon is used to perform this collection, monitoring any device or system that generates data, and present the information in a graphic and intuitive way at OpMon Dashboards platform.
Dashboards make it easy to understand the company’s scenario
Understanding the scenario, from the past to the present moment, is critical for companies to predict trends and act quickly to keep competitive in the market. Promoting a company-wide overview, dashboards contribute for a fairly complete scenarios assessment and gives the opportunity for the company to plan the future with greater security.
Visuals make communication uniform
Not all team members have the knowledge required to perform technical readings on finance, budgeting, development, logistics, etc. With dashboards, the company takes advantage of a more effective form of communication, because they are based on dynamic visuals such as graphics, infographics, trendlines, among others, to illustrate the company’s performance more clearly and objectively. In addition, it horizontalizes the information and increases transparency between areas, which allows greater integration and discussion through a same language.
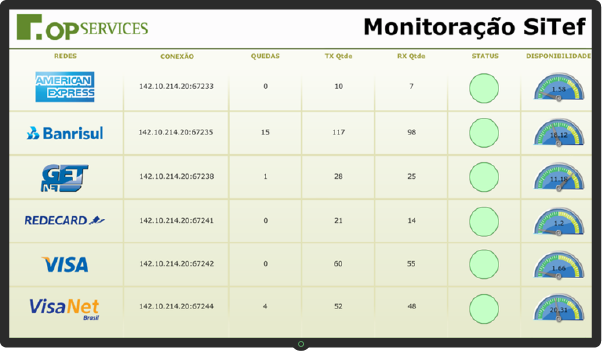
SiTef Monitoring Dashboard
Risks are noticed more easily
Risk management is part of business routine and should be a constant concern for staff. In this sense, dashboards help detect risks more easily, illustrating critical paths in projects, identifying planning gaps and making all of this more visible through the previously mentioned visuals. Identifying infrastructure or business problems as soon as they occur enables greater agility in their resolution before they generate irreversible financial losses.
Company’s wide-ranging vision to measure results more effectively
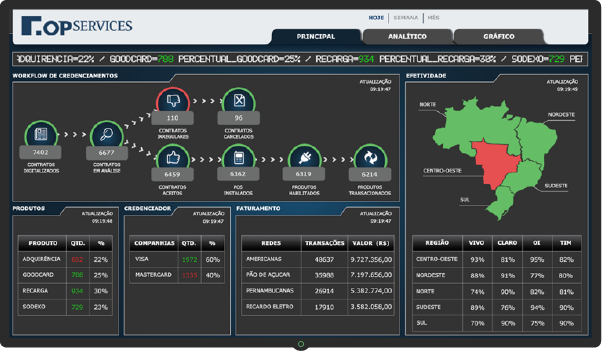
The results should be monitored daily, which can be done through dashboards that allow both an overview and a deepening in some details on the indicators and business metrics. This information is what indicates whether the company is on the right track; therefore, it should be treated as a priority, and dashboards can handle that. Some of the OpServices’ customers perform decision-making from indicators from dashboards.
Business Vision Dashboard
With dashboards, decision-making is immediate
You can forget analysis of extensive reports, discussions, disagreements and conflicts. With dashboards, the information is accurate and decision-making is made from data and facts, that is, proven information.
Dashboards models per segment to apply in your company
Does your company use dashboards to perform IT and business management? Click here to view some examples of dashboards developed by us and by some of our customers to streamline decision-making.


