

Find out which Service Desk metrics are most important to your operation
We may even not like them, but metrics are key to measuring results in any area. With the data provided by them, it is possible to better control the team, have more satisfaction at work and demonstrate the commercial value of the department. It is necessary to keep in mind that something that is not measured cannot be improved or managed.
In the Service Desk, fortunately, the current pieces of software (see Qualitor, our partner) allow you to capture many performance data. With the right analysis, Service Desk metrics help you make decisions more effectively and thus increase efficiency in delivering IT services. When consistently tracked, they enable us to identify and act on improvement needs.
While it is possible to measure anything, more metrics do not necessarily translate into better tracking. Among the most common errors, these can be highlighted: not tracking trends over time, not setting goals and not sharing metrics reports.
It is essential that the Service Desk be evaluated to enable you to create a standard of excellence. Therefore, follow the post today and check out 5 important metrics for your business!
What are the most significant Service Desk metrics?
The Service Desk Institute (SDI) has presented a list of best practices and most commonly used metrics by the IT Service Desk. Among the most important ones are:
1. Resolution Percentage in the First Contact (First Call Resolution – FCR)
It is one of the best Service Desk indicators. It evaluates, besides the IT team’s competence, the end user’s degree of satisfaction. The FCR identifies systems that need specific maintenance and level of contentment from team employees, as well as reducing operational costs and making customers satisfied. Ideally, FCR rates should be above 70%.
2. Number of incidents and requests
An easy-to-obtain metric that helps you understand if the amount of resources is correct. You can group the data by channel (phone, e-mail, social media, etc.) as well as by day of the week, day of the month and time of day. With this data, you can optimize resource planning.
3. Using the agent
Ideally, every agent would be busy all the time without the need for overtime but the reality is that if the work rate is above 70%, resource turnover dramatically increases.
4. Cost per contact
This quite powerful metric can be deceiving: Some cost per contact higher than average may not be bad, just as a lower than average may not be good. If the low cost per contact is accompanied by poor call and low FCR, for example, this is bad news. If the FCR metrics is high, however, even if the cost exceeds the average, there is no problem.
5. Resolution Rate in the First Level
It influences total costs for end-user support. When incidents are sent to a top-level technician, the FCR falls, resolution time increases and costs go up. Sometimes escalation (triggering a technician from another level) can not be avoided but generally the more calls are finalized at Level 1, the better.
Okay. But what is the best way to visualize Service Desk metrics?
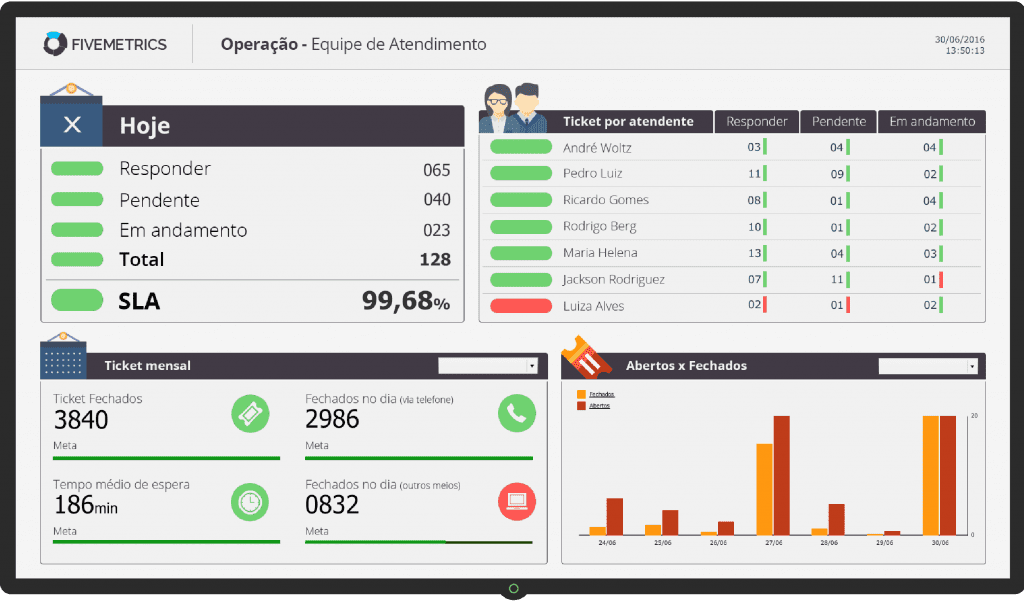
In addition to tracking your Service Desk metrics, you need to view the data in a user-friendly and easily understandable format. That is, it allows for quick action to solve problems or apply improvements. From OpMon (software for monitoring IT) it is possible to build Dashboards that search data from any tool, including the Service Desk:
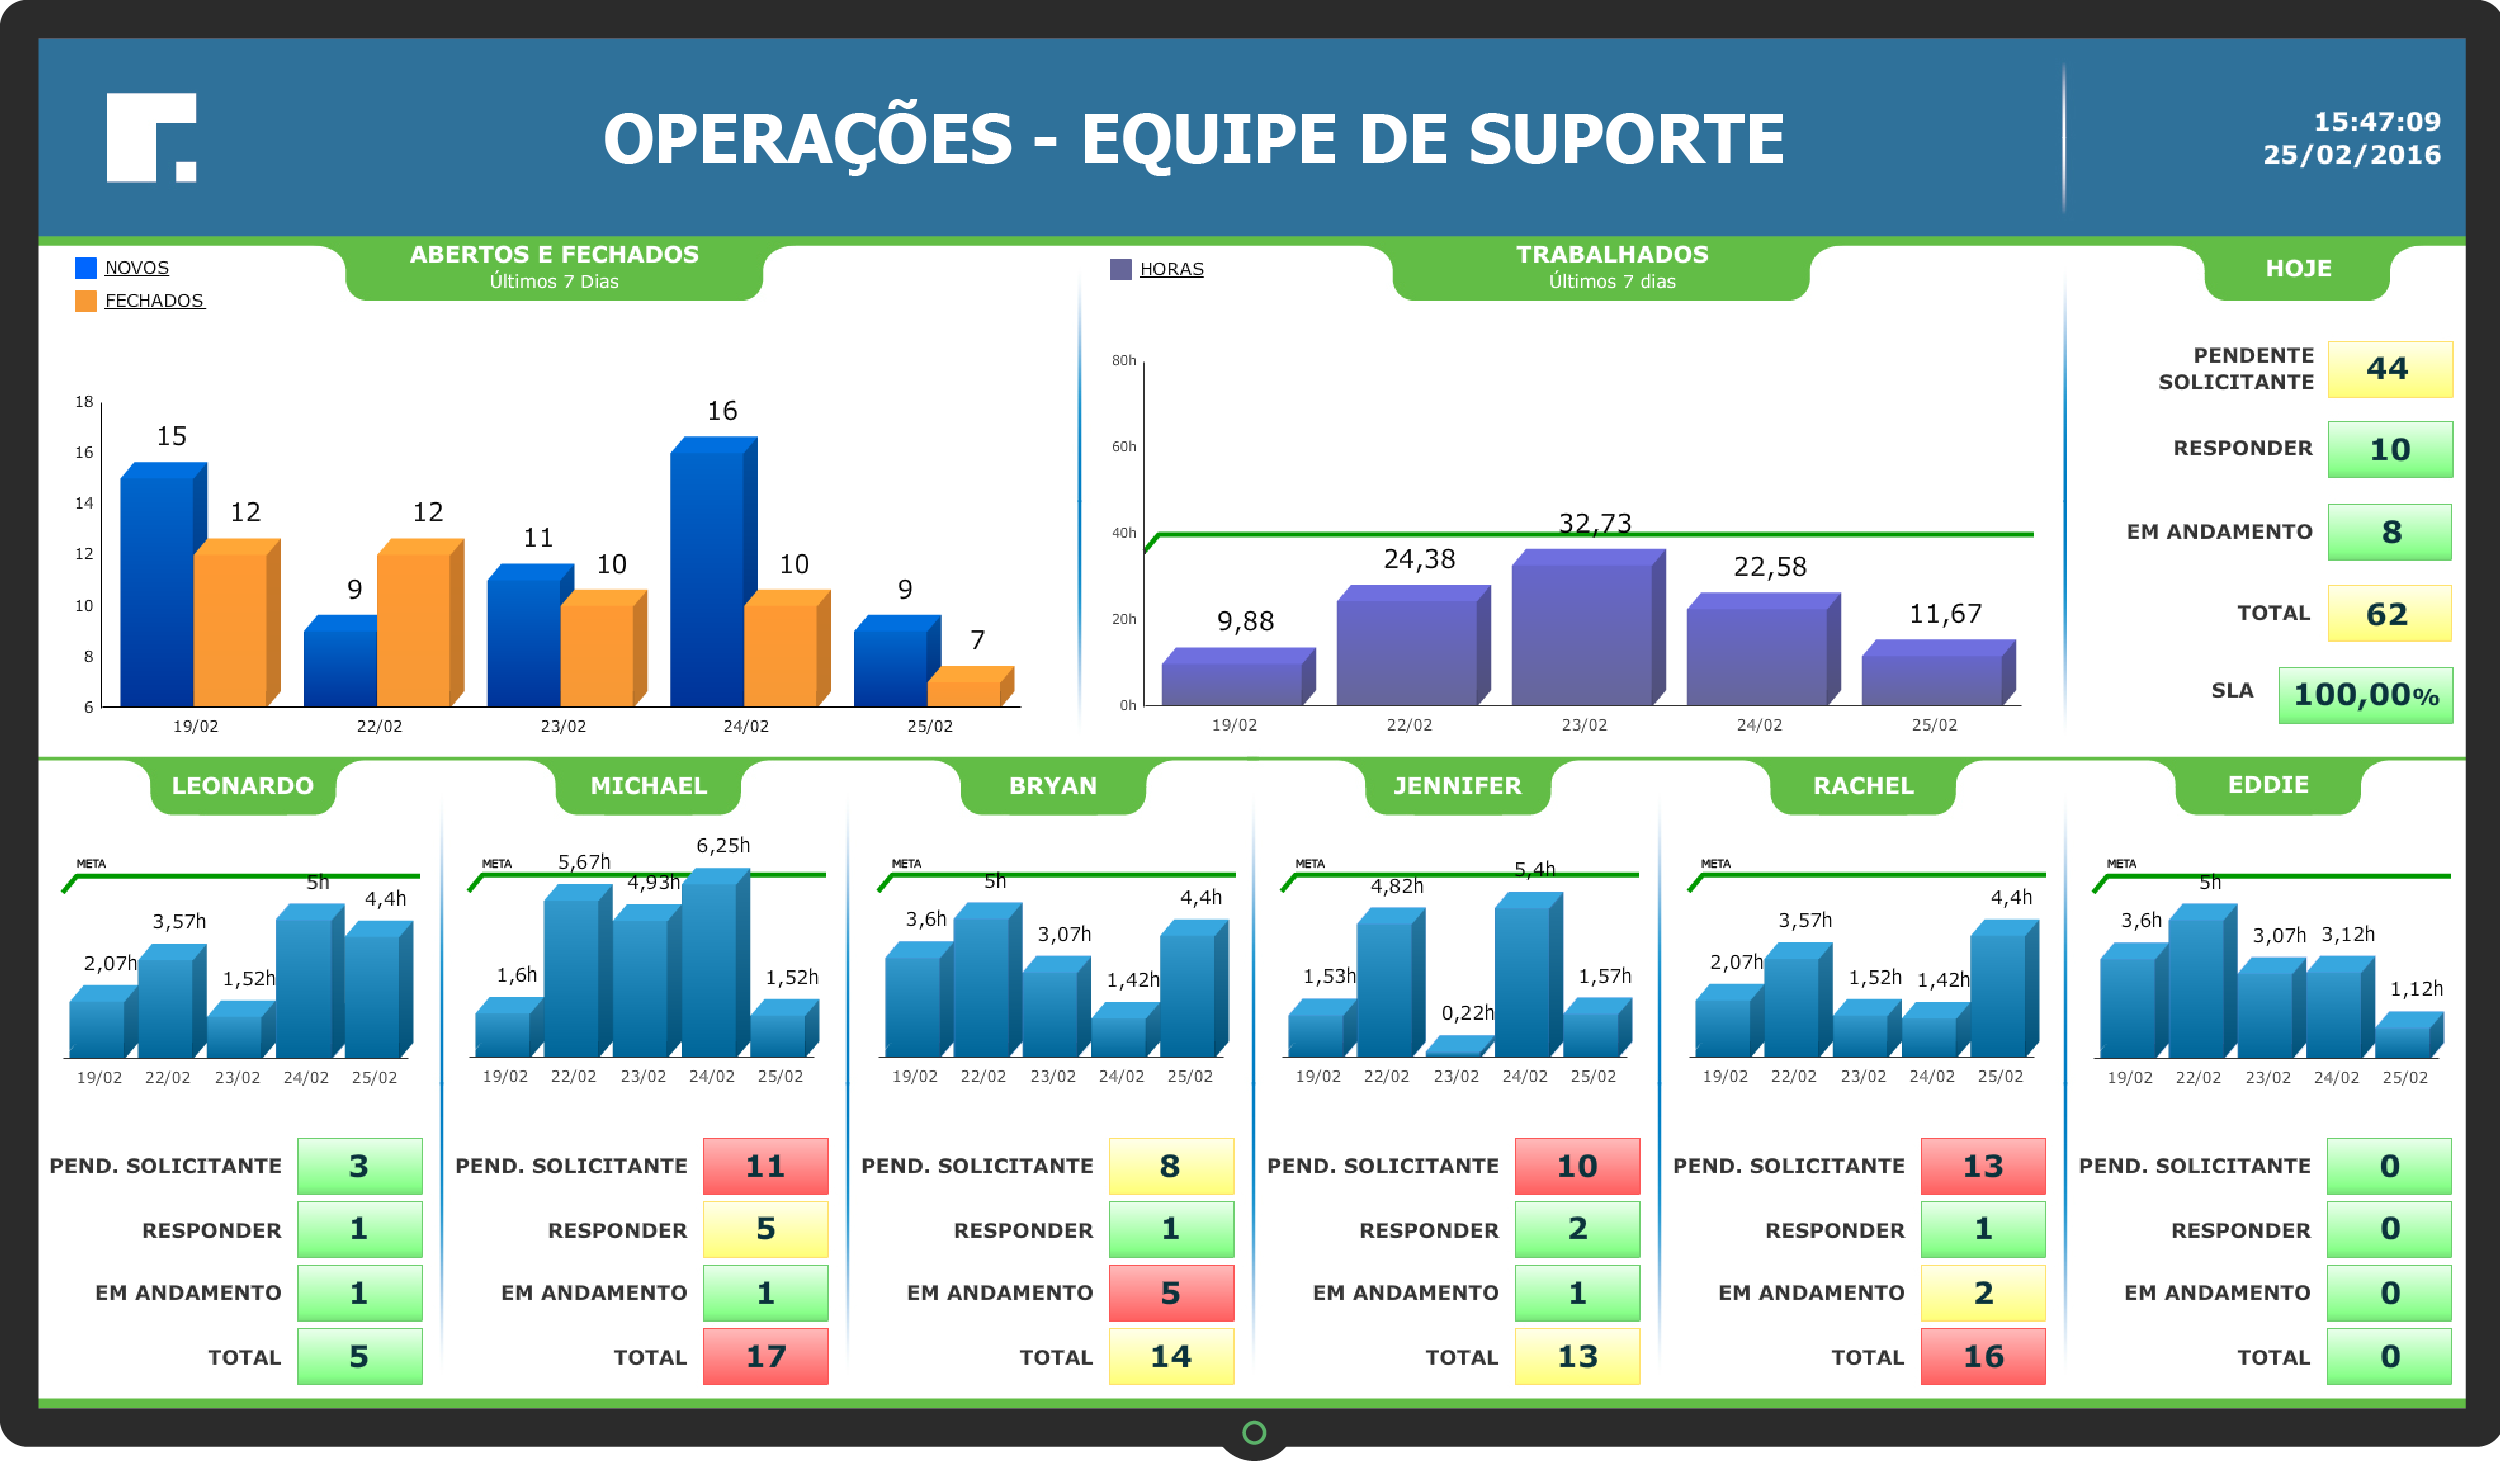
In the example above it is possible to monitor the support team’s performance in real time. In this case, it is the same Dashboard that we use to monitor our staff in customer service.