

The fact that Nagios is the open source world’s most popular networks and systems monitoring platform is known to everyone. Although several other as or equally complete solutions have appeared, Nagios has more than 50% market share of the installations of this type of platform in IT infrastructures. OpServices has been supplying services based on the Nagios platform since 2003 and since we have identified a number of areas where Nagios OSS (open source version) does not fully meet customer needs. That’s not a big problem for the platform, because that was never the proposal behind Nagios, its main focus is on developing a high performance, flexible and scalable monitoring core.

Although the software in its standard version is functional for the vast majority of IT environments and their basic monitoring needs, when applied to a commercial environment where the issue of IT governance is at a greater level of maturity, Nagios shows its weaknesses. This is particularly evident in some areas like:
- Lack of compliance to the best IT management practices such as ITIL;
- Lack of more complex reports on availability, capacity planning and SLAs;
- An overly technical and easy to use graphical interface;
- Lack of a graphical tool for configuring the platform;
- Lack of multilingual interface support.
Expertise to develop
After several years installing Nagios OSS for customers, many of OpServices’ customers have come to require more advanced features on the platform that somehow the free software community would be unable to address quickly enough. Therefore, we began a project to customize the basic platform, which resulted in OpMon, a network and systems management platform based on core of Nagios OSS, but that addresses the demands of customers in unattended areas.
One of the first questions that we addressed was the issue of multilingualism, however, as it was not enough just to translate Nagios to Portuguese (which we did in the first deployment of OpMon), it is also important to create a new graphical interface for Nagios, based on PHP and no longer in CGIs. To this end, we hired a consultant to work on the usability of the software. The goal would be not only to achieve a less “technical” interface but one that was more intuitive and capable of supporting multiple languages. So, OpMon created a completely independent interface layer and added several modern features to enhance usability, like the ability to create search filters, bookmarks, shortcuts, and simplify navigation.
Another very important point was to create modules for advanced reporting and service level management (SLA/SLM). One of the most important items addressed at this stage was the creation of time slices in when generating reports. For example, if you want a report on the utilization rate of your internet last month, you may be surprised to learn that the rate of internet use is around 60%, that’s because Nagios counts 24-hour time periods, that is, it includes the night and weekends when the rate of use of your network is possibly much smaller and, on average, it may provide a monthly user rate that does not reflect the reality of use during business hours. When it comes to justifying the investment to upgrade your internet link, maybe there is a lack data to justify it. However, during normal business hours use is always close to 100%. So, OpMon provides the possibility to create custom time slices, allowing the user to issue a report, which shows whatever time slice you want, for example, only during business hours (8am to 6pm, Monday to Friday), making it easier to justify investments in accordance with your company’s real situation.
By storing performance information of the items collected in a MySQL database, OpMon allows the generation of complex reports on capabilities, including projected future resource depletion, trend line monitoring and the ability to provide monitoring via the generation of baselines. This model allows monitoring to be done adaptively and not only based on fixed thresholds. I’ll explain, with traditional monitor, alarms are sent based statically established on limits. For example, when reaching 80% of CPU usage, an alarm is generated automatically, whereas with adaptive monitoring historical data can be used to set the limit dynamically. It may be that every Friday from 6:00 pm to 10:00 pm, CPU utilization is really above 80% due to some common and absolutely normal processing. With traditional monitoring, alarms would be generated every Friday between 6:00 pm to 10:00 pm. By contrast with adaptive monitoring, based on historical data, this behavior would be considered normal and no false alarm would be generated. Of course, neither one of the approaches is perfect, but both can be combined in order to dramatically reduce the generation of false positives.
Still on the issue “smart’, monitoring, OpMon has an auxiliary module for event correlation. The correlation of events is a topic even more advanced that adaptive monitoring because it allows the creation of complex rules to correlate (and generate alarms) the events that are centered on the platform. Assuming that OpMon is a large repository of events, EventGuard allows you to create complex rules for event correlation via an intuitive graphical interface. Perhaps one of its major applications is the correlation of security events, where apparently disconnected access may actually be correlated with an outside attack by hackers on your network.
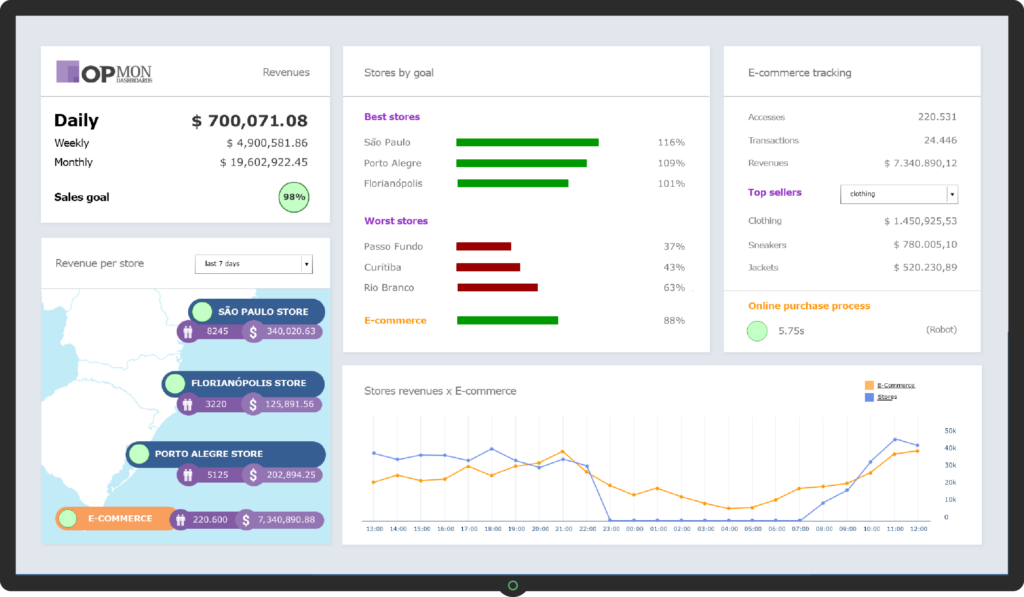
Perhaps OpMon’s most visually interesting module is the dashboard editor (OpMon Dashboards). Originaly created in order to allow the OpMon platform user to graphically and interactively create dashboards that represent the monitored items. With the DaVINCI editing tool, it’s possible to build complex dashboards that display the real-time status of infrastructure elements and particularly the business process, which represents a step beyond the basics of IT infrastructure monitoring. DaVINCI is perfect for giving visibility to your IT and business environments on large LCD monitors. With DaVINCI you can create dashboards without the need to write a single line of code, only using its advanced graphic interface. This application can also be downloaded, purchased and used in any Nagios environment without the necessarily having OpMon.
One of the weaknesses of Nagios is its complex configuration, which is all based on several text files. Although quite comprehensive, Nagios requires a thorough knowledge of its configuration files. There are several free software designs that address, one way or another, the weakness of this platform. OpServices developed a 100% web configuration tool to allow OpMon configuration without the need to know the various Nagios configuration files, and store these settings in databases, which allows greater ease of storage and retrieval settings.
Another important strength of OpMon in relation to Nagios is its compliance to the best management practices specified by ITIL. OpMon has tools that allow you to natively create Service Catalogs and generate and monitor service level agreements (SLA/SLM) that can be represented in DaVINCI, showing the impact on a particular IT service when a failure occurs in one of the elements that make up that service in the Catalog. OpMon is also closely integrated with Service Desk and CMDB platforms adding ITIL best management practices such as Service Request Fulfillment, Problem Management, Incident Management, Configuration Management and Asset Management, Change Management and Knowledge Management. A network server discovered using OpMon discovery methods for example, can be imported into becoming a monitoring configuration item included in the CMDB and managed to maintain an integrated link between: data collected in monitoring, hardware and software information stemming from the active inventory process and actions taken on the Service Desk throughout the life cycle of the OpMon items and services settings.

At anytime, the CMDB can e consulted to obtain a history of the versions of this and other configuration items that are or were managed by OpMon, so accessing knowledge of linked information such as dependencies between configuration and services items themselves, answered requests, incident resolution, changes made, problem solving, among other information available on the knowledge base, since all these inputs are remain registered on the CMDB even when the configuration items have been removed from OpMon, thus providing important information that will assist in designing new services.
Over the years, OpMon has implemented several improvements in relation to the scalability and performance of Nagios, with various improvements having been sent as contributions to the team that maintains the Nagios core. Some of these improvements have been incorporated into the final code of the Nagios OSS, while others are only available on the OpMon platform. Perhaps the biggest improvement in terms of scalability and performance lies in the use of OpMon Gearman (http://gearman.org/) as a distribution platform for processing Nagios. With the incorporation of Gearman in the OpMon platform, it was possible to gain up to 250% in the capacity to manage OpMon configuration items, and ensure scalability far beyond that possible with the use of the standard platform.
In summary, the Nagios OSS is an excellent platform for managing networks and systems, but like all software it is not the panacea for all business needs, even with the huge variety of projects adhering to Nagios. With IT infrastructures becoming increasingly lean, the need to facilitate the work of CIOs and network administrators has led OpMon to evolve towards providing greater ease of use, deployment and advanced integrated features, while continuing to maintain its compatibility with the Nagios core and remaining 100% compatible with the vast library of freely available plugins in the Nagios Exchange.