

Do you know what metrics and indicators are? What are their main differences?
Metrics and indicators are two common terms when it comes to IT planning and management. Both help measure and quantify operations results and provide the foundation needed to evaluate and review work in progress.
But they also have distinct formations and uses that are often confused even among the most experienced IT managers. Do not make that mistake! Learn the difference between metrics and indicators right now!

What are metrics?
Metrics are crude, atomic and simple composition measures, such as value and quantity formats. They are the basis of any operational follow-up. They are not designed to be used as a basis for strategic decision-making, since they measure more than they actually point to some concrete result. However, crossing them with other information may reveal more substantial data. Do not confuse them with the famous “success metrics,” popularly known as KGIs (Key Goal Indicators).
What are indicators?
Indicators are calculated measures of performance consisting of a set of different metrics. They are also called Key Performance Indicators or simply KPIs.
Because they are a bit more complex data (and may contain more than one variable), performance indicators can provide a more accurate view of a situation and its historical evolution. They work as clues as to whether everything is going well and whether the desired goals have been achieved.
KPIs evaluate organizational performance, assist in trend analysis, promote continuous improvement and proactive performance, besides transparent management of processes and staff. They are usually expressed in percent rate or frequency formats.
What is the best way to use metrics and indicators?
Knowing what metrics and indicators are relevant to the IT industry is just part of the job, which shall not help if these numbers are not closely tracked. Many problems are no longer anticipated simply because those in charge are not looking at the metrics and indicators as much as they should be. Facilitating access to this information is essential. The best way to ensure follow-up is through building Dashboards.
Dashboards are visual boards that centralize information based on metrics and performance indicators that have been defined as relevant to the IT industry. They allow the creation of a multitude of possibilities of ample visualizations and easy interpretation of data. See an example below:
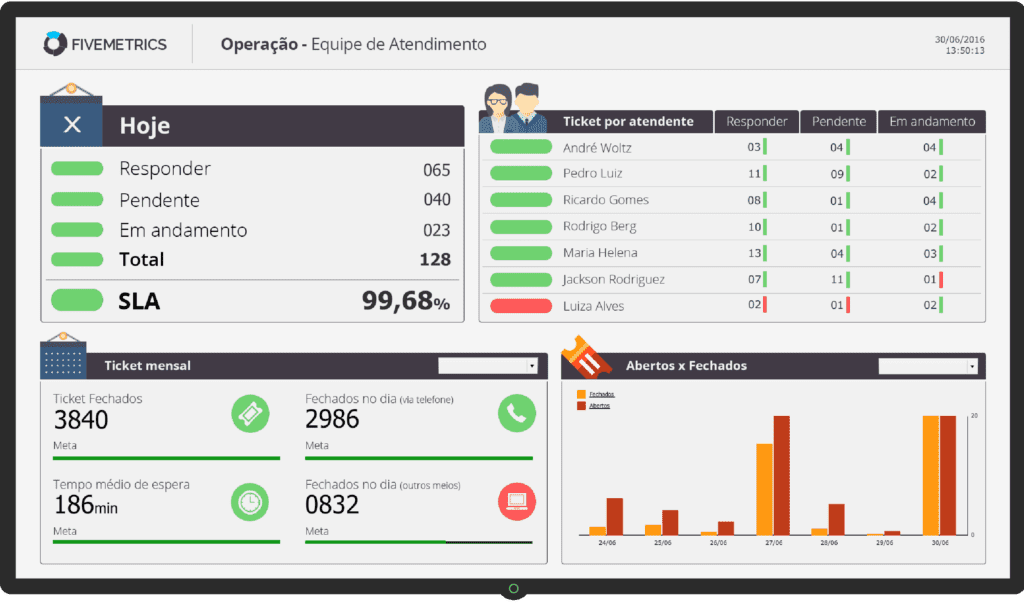
The results achieved and what needs to be improved shall always be accessible to the entire team, who shall be able to follow closely the evolution of the work developed and realize in which points it needs to improve to reach the established goal.
How to use metrics and indicators to improve the management of your business?
By using sets of metrics (indicators) that make sense for making decisions, you can have an effective control over the results of your area or your business. If they are built to generate charts automatically, as well as with alarms, all this updated minute by minute, this is even better!
This visualization of indicators in real time and anticipating the problems is called Visual Management. This is because managers share metrics and indicators with all employees and with that it is possible to have a team that is more committed to the outcome.
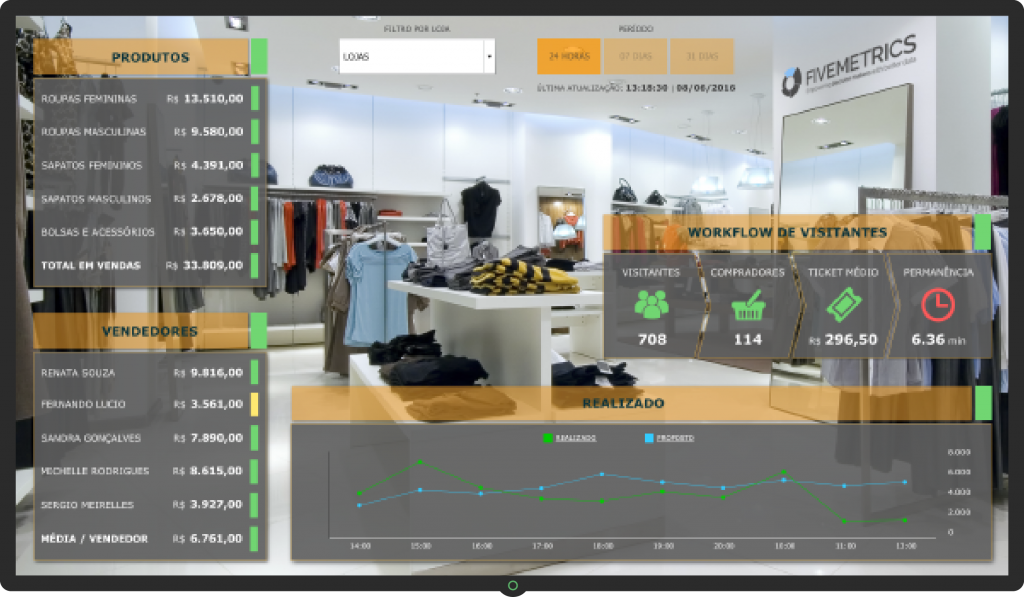
In this other example below, a Dashboard built from the OpMon platform, it is possible to understand relevant information to make decisions on sales area indicators:
Now that you know the differences between metrics and indicators, you shall never again confuse the two terms. Failure to properly understand both concepts can lead to one of the greatest dangers when we speak of monitoring and measuring results: misinterpretation of the data.
It is important to differentiate metrics and indicators to know exactly when and how to use each of them in favor of business.