

Five important metrics for your business / marketing area
Evaluate if the actions deployed in a technology company are adequate is an essential factor for it to generate profit and become prosperous in the market, even in times of crisis. To find out if your organization is on the right track, you need to follow up with your metrics, in particular 5 of them, which were described throughout this post. Get to know what they are and understand why evaluating them will bring benefits to your business!
1. 1. Lifetime Value (LTV) (LTV)
The Lifetime Value is a metric that aims to find the value of a client through the services he uses in a particular company. When you find the numbers relating to the profitability of the consumer, it is possible to assess how much to spend and how to spend with him, favoring the reduction of costs and optimizing the results of the organization. This way, you can calculate how much that customer pays you in a long-term relationship.
To make the calculation of this measure, you need to find the life cycle (LC) of the buyer, that is, how long he has been a client of the company; the value of the average Ticket (AT) spent by him in a purchase; and the average amount of Sales per customer (AASC), which shows how many purchases a consumer conducted during a period (to find it, divide the total sales of the time measured by number of customers). Thus:
Para fazer o cálculo dessa métrica, é preciso encontrar o Tempo de Vida (TV) do comprador, isso é, quanto tempo ele é cliente da empresa; o valor do Ticket Médio (TM) gasto por ele em uma compra; e a Quantidade Média de Vendas por Cliente (QMVC), que mostra quantas compras um consumidor realizou durante um período (para encontrá-la, divida o total das vendas do tempo avaliado pelo número de clientes). Desta forma:
LTV = AASC x AT x LC
2. Customer Acquisition Cost (CAC)
One of the metrics used to evaluate the viability of a project is the CAC. With it you can find out how much a company spends so that a lead becomes a customer. Knowing it allows the company to verify that the expenses they have to conquer a consumer are no greater than the profitability that this consumer will offer on his purchases.
To find the CAC, add all the expenses in a given period for attracting new customers (with communications, marketing, sales, product development, etc.) and divide the amount by the amount of effective customers. The parameter to define whether the result found is good or not, is the Lifetime Value. CAC shall be 2 to 3 times smaller for the company to determine that they are on the right track!
3. Cancellation Index
The Cancellation Index or Churn Rate, is the metric that allows a company to identify what is the average of terminations from their customers. To find it, divide the number of cancellations of a service by the number of active users in a given period. The lower the score, the better the evaluation of strategies of enterprises for customer retention.
4. Average Revenue Paid by User
To know what will be your profitability with the client during the period in which he has a relation with your business, you must use the metric of average revenue paid by user. To find this number, find the total amount spent by customers in a period and divide by the total number of consumers. The result will inform the profitability that was generated for every buyer, which will make it possible to evaluate and develop new strategies to increase profits.
5. Conversion Rate (CR)
The conversion rate refers to the number of customers who bought on a site (conversion) in relation to the traffic generated on the page. Calculating it is easy: just add up the total visits and divide the value found by the number of sales. When evaluating the data, you can make adjustments in a business page to identify whether Web surfers are generating signups and purchases or if they are suffering dispersions that have prevented them from concluding a purchase.
And then? What’s the next step after measuring the indicators?
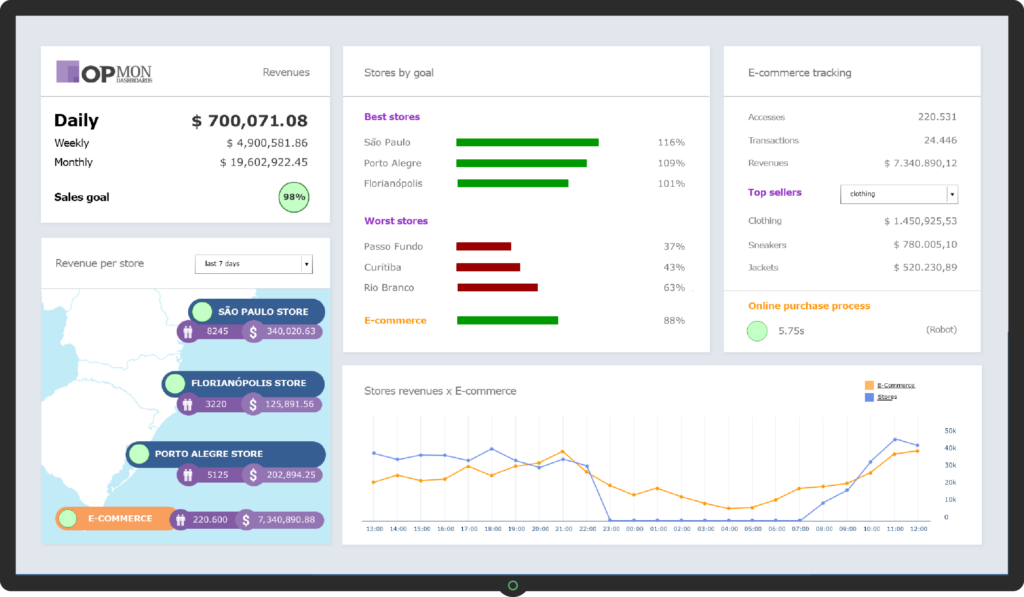
One of the ways that OpServices always suggests to corporate executives is to make use of dashboards to make decisions in real time. The dashboards are visually prepared panels to be easily understood, through indicators that summarize the main processes of the organization.
Read also: Management at sight and monitoring of business processes in real time


