

Real-time analytics help you make decisions faster, more accurately and more effectively than those made randomly or based on obsolete data. However, real-time analysis requires accessible, easily viewable and understandable data.
One way to do this is to use Dashboards with real-time charts in the Visual Management strategy. But is tracking real-time charts necessary for your business? Follow our post and find out when it is needed or not.
When using real-time charts IS NECESSARY
The speed of the connected world does not open loopholes for decisions to be postponed. A small problem that occurs with an isolated user soon gains traction with the strength of social media and what could be just an ember becomes some fire of epic proportions. Every manager who is minimally aware of the market knows such a case. You need to be able to offer a quick fix to problems!
Passive firms that wait for problems to knock on the door tend to stagnate, while those which operate with intelligence and can quickly identify problems gain a huge competitive edge. Real-time charts can be powerful allies for anyone willing to solve problems before they make a big impact or users realize them.
When creating a Dashboard, when it comes to defining whether it needs data in real time or not, the first thing to think about is whether the information contained in the Dashboard contributes to short-term decision making. That is, based on specified data, is it necessary to make a decision now or in the next few hours or shall this action be taken only in the next few months?
An example of real-time data need is the IT infrastructure area, which needs to provide maximum availability for the operation of all enterprise resources. Monitoring availability on a real-time infrastructure Dashboard can be the key to making faster decisions. Likewise, a Service Desk Dashboard with call handling may point to some kind of anomaly in the level of service delivered that needs to be handled on time to avoid stacking new requests that shall overwhelm the staff.
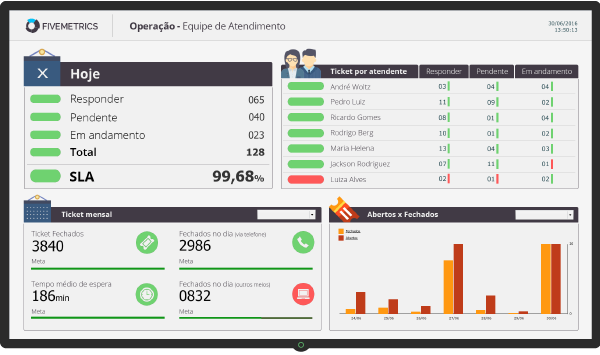
Real-time charts make problems visible at the time they occur or even detect them when it’s just a threat. In charts generated by the OpMon Dashboard, for example, it is possible to issue a notification or trigger an automated response to the person in charge of the area. Dashboards have OK, warning, and critical status so that visual notifications can help the team identify a problem as quickly as possible.
When using real-time charts IS NOT NECESSARY
Do you know the biggest danger of having too much data to analyze? In the end, we do not have any information. Information is the data processed, that is, correctly mined and analyzed.
The problem of monitoring with real-time charts all the data you are able to collect is that the overhead of numbers, indicators and content being constantly updated can take analysts’ focus on information that might be most useful to the company’s strategy. In addition, it requires a computational capacity that ends up being wasted with data that makes no sense in the real-time aspect.
Before you adopt the use of real-time charts in your Visual Management system, you need to ask whether looking at those data in real time shall actually bring some business benefit.
For example, if you wish to collect information only to generate Business Intelligence (BI), the information does not need to be analyzed instantly. BI consists in evaluating the results in retrospect to solidify some knowledge that shall be later consulted to support strategic decisions. That is, it is a great tool to make strategic decisions that shall not change overnight.
As we have said above, real-time charts are powerful allies in identifying problems at the time they happen. But shall the instant solution to the problems identified in real time really be a competitive edge for your company? Usually the answer is neither, but the use of both. That is, using real-time charts for information that needs instant (mainly operational) action and consolidated charts when they provide support for a strategic decision.
Have you got any questions? Ask yourself, understand whether your strategic goal requires your team to track real-time charts, consult a specialist and plan the best Visual Management strategy for your business.


