

How Visual Management and business processes monitoring can improve the efficiency of your business
The main question I want to answer throughout this post is, “Why should your company begin to monitor real-time business indicators from now on?” Well, what do I mean by that? There is a lot of information available to businesses, but they are not available in a simple and intuitive way to make a decision. There is information scattered in various systems such as: Excel spreadsheet, Google Analytics, ERP (Enterprise resource planning) systems such as SAP, databases, sales system, among many others.

Having all this information centralized is essential to improve the companies’ services and processes. The flow of concealed information within organizations is huge. Tools are increasingly popping and are able to seek that data and turn it into usable information for decision-making. Dealing with information through technology enables decision-makers in the business world to base work on key indicators, or KPIs (key performance indicators).
The solution to the problem of invisible or unavailable indicators for decision-making is the Visual Management. Visual Management can be any type of data visualization, such as a chart with tasks in progress or pending. Or else what we believe is the best solution to the problem, which would be the dashboards with real-time data.
Visual Management purpose is a strategic vision of the indicators for improved management, with dashboards accessible to all employees to visualize what needs to be improved and outcomes. These dashboards can be placed on LCD screens in rooms where employees are able to see them daily.
Visual Management benefits:
- Anticipating problems;
- Stopping being a reactive business area and becoming proactive;
- Setting alarms for immediate decision-making;
- Transparent management for the whole team;
- Using real data without the need for human intervention;
- And identifying the root cause of problems.
In this dashboard example, we are monitoring credit card brands transactions such as Visa or American Express.
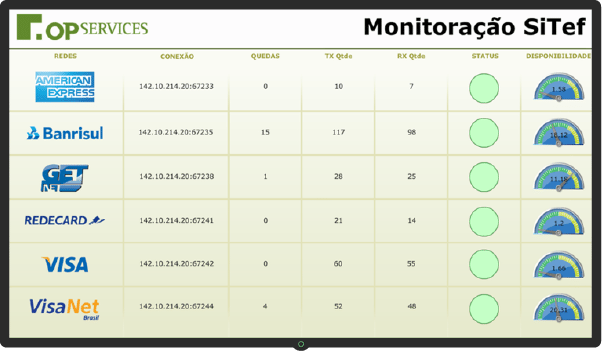
SiTef Monitoring Dashboard
If problems arise in connection with financial services providers or the infrastructure of your company prevents the transactions from being carried out, these problems can be alerted on in real time, allowing your company to take action at the exact time of the problem, before queues are formed in your stores and consumers leave dissatisfied because they cannot complete their purchases.
As the main benefits for Visual Management through OpMon dashboards, we can mention the greater visibility of business and IT indicators, improved communication among different areas of the company, the possibility of assisting the organization to speak the same business and indicators language, the possibility that all company levels can understand how much, when and how your industry affects the company, and also the possibility of providing a justification for investments through concrete data and a justification for spending cuts through information about your business.
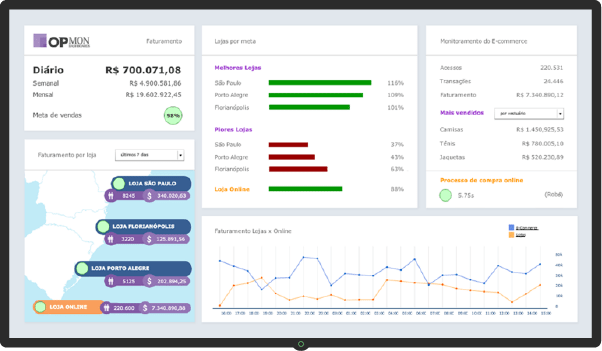
In this other dashboard example that we have developed for one of our clients, it is possible to manage the commercial area indicators such as daily, weekly or monthly transactions, with real-time sales charts and to create filters to view specific information about each store or each product sold. Information can be collected from a database of sales systems or any application that allows reading data to be plotted in the OpMon dashboards.
MONITORING THE USER EXPERIENCE
Another Visual Management support tool is to monitor the user experience by means of robots. They simulate all the user’s steps when using an application and alert about any problems. To this end, we have developed OpCEM, or Customer Experience Management. It enables avoiding, by robots simulation: dissatisfied users, breaches of service agreements, phone lines jam (for complaints), the non-achievement of quality goals, and lost revenue.
This is possible from the simulation of all the steps necessary to, for example, make a purchase at an online store, where the time period to select a product, add to a cart and fill in the credit card data can be managed by OpCEM. This way it is possible to identify the availability of services, situations where errors occur, the speed of applications, the impact of the problems, and the real dimension of these problems.
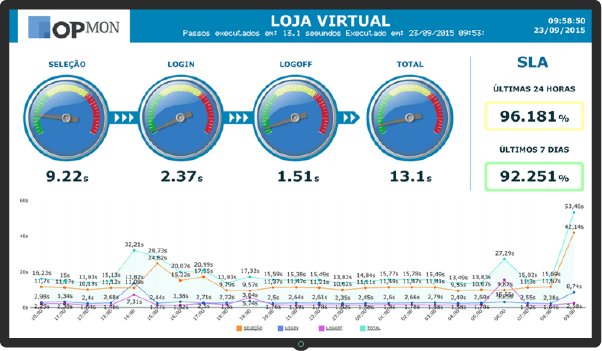
In this other example, we can see the steps of a robot to simulate the issuance of a payment slip duplicate. The robot simulates the portal access, accesses a restricted area, accesses the payment slips area, performs the issuance of a payment slip duplicate and finally concludes the process. In addition to measuring the time for each step, we can also see the total elapsed time for the completion of the entire process. In this case: 3.37 seconds.
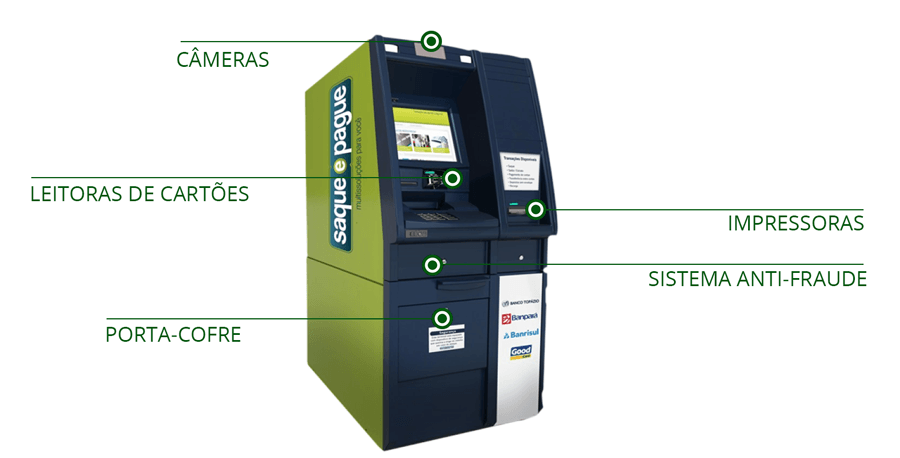
SAQUE & PAGUE CASE
One of our clients is Saque & Pague, which produces technology for ATMs. At this customer, we monitor over 60 indicators only at ATMs, such as: security cameras, power shortage, the card reader, the vault doors, printers, temperature sensors, and anti-fraud systems. If failure of any of these indicators such as, for example, vault door or anti-fraud system, is identified, OpMon generates a notification to all the listed people in charge for the resolution of this problem.
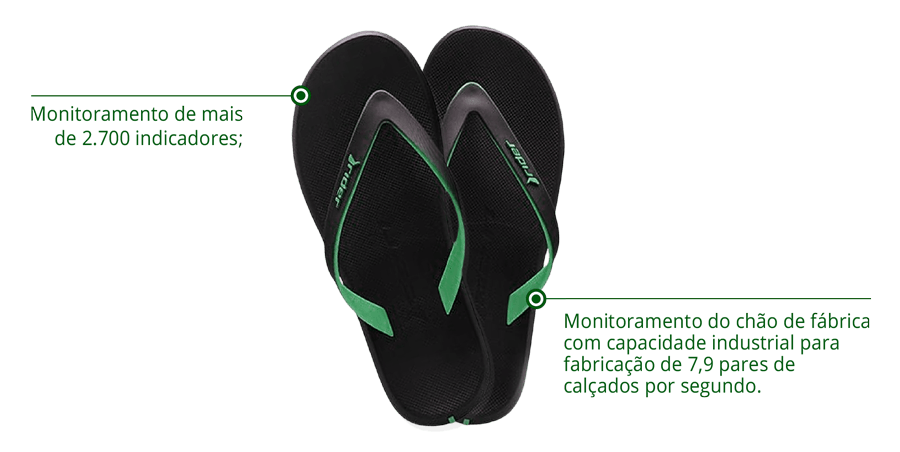
GRENDENE CASE
Grendene has an industrial park with a manufacturing capacity of 7 pairs of shoes per second. The manufacturing shop floor, as well as all subsidiaries, is monitored by OpMon. Today there are more than 2,700 managed indicators such as infrastructure indicators and data that are used in the Balanced Scorecard (BSC) and impact the company’s management.
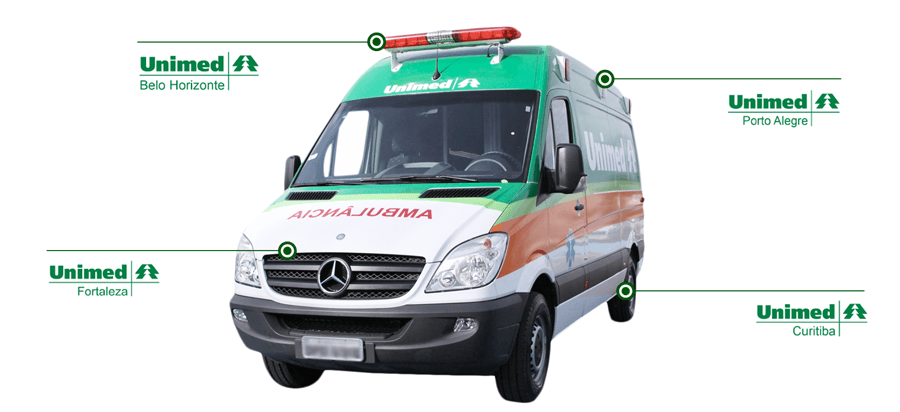
UNIMEDS CASE
A very successful case for the OpServices are the Unimeds. Among the monitored Unimeds are the cooperatives in Porto Alegre, Curitiba, Belo Horizonte, and Fortaleza, as well as several other country towns in these states. In these Unimeds, the monitoring of their core business takes place with IT services that operate the critical business processes, such as the procedures authorization system, monitoring the portals by robots, the authorization of exams and surgeries, the receiving of electronic accounts, the billing and collection processing.
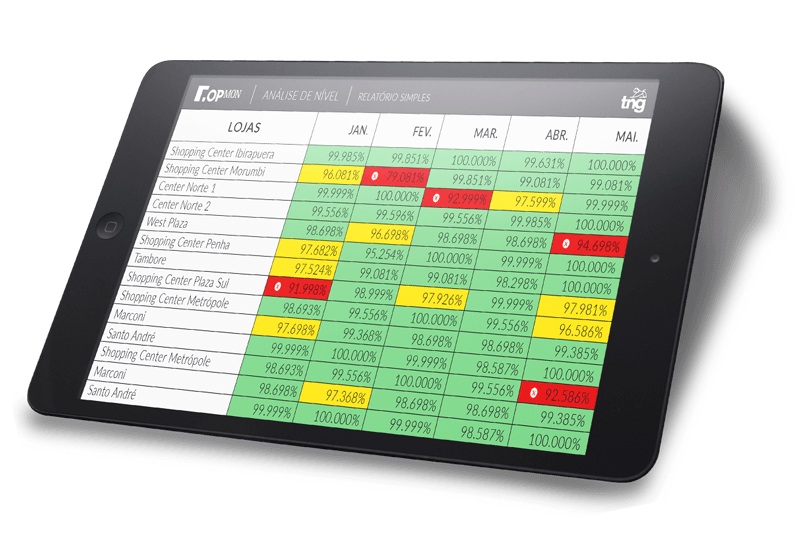
TNG CASE
With OpMon it is also possible to perform the management of suppliers with the creation of reports of financial losses caused, for example, by faults on communication links. At one of our clients’, TNG, the IT staff created a report to verify if the Internet service hired is actually delivered by the service provider. Every end of month, the manager receives by e-mail a report with data on the availability of the Internet links. If the service provider offers a lower amount than the one contracted, TNG receives a financial reimbursement.
BUSINESS BEHAVIORAL MONITORING
One of the great advantages of OpMon is the possibility to monitor business behavior with the use of a weather forecasting algorithm to identify business behavioral patterns and find results outside the expected limits. The analysis of the data collected, based on past behavioral patterns history, generates real-time alerts about changes in the state of a business indicator over the standard conduct. This technology was developed for a client of ours in the banking industry, Banrisul. The bank has Vero, an equipment for processing financial transactions by credit card.
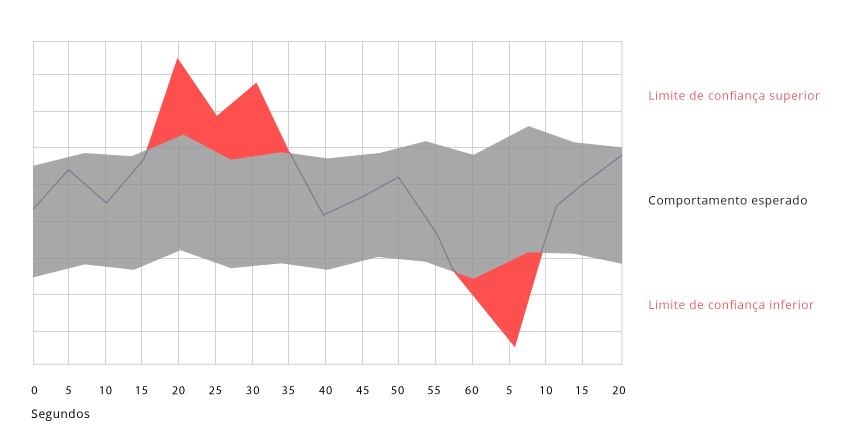
From the history of financial transactions, OpMon can estimate an expected behavior and notify the people in charge for any anomalies. For example, on the first working day of each month, an “x” number of transactions is expected. If the number of transactions on this day is outside the estimate and confidence limits, OpMon sends an alert to those accountable.
These were just a few examples of managing business processes. Each vertical has specificities that require customer knowledge of their own business and a lot of experience and vendor flexibility to meet the business different demands.
To learn more, download our whitepaper: dashboards catalog.


