How to choose an IT monitoring solution?
The IT monitoring and management market has grown a lot in recent years. Increasingly, companies seek to ensure maximum availability of IT resources that underpin companies’ business. Moreover, with the increase of information speed, any failure in the systems ends up harming the image of the company. Recent downtime in the S3 (storage) structure of Amazon has affected over 175,000 websites around the world, mostly in the United States. This has affected companies such as Netflix, Spotfy and Airbnb, thus undermining the clients’ confidence on Amazon as to its guarantee of availability.

To avoid these problems, or at least lessen them, the first step is to monitor the IT and business environments. However, the amount of solutions available on the market can confuse buyers. To help you, we have listed 10 reasons why you should choose OpMon as an IT management and Dashboard visualization solution!
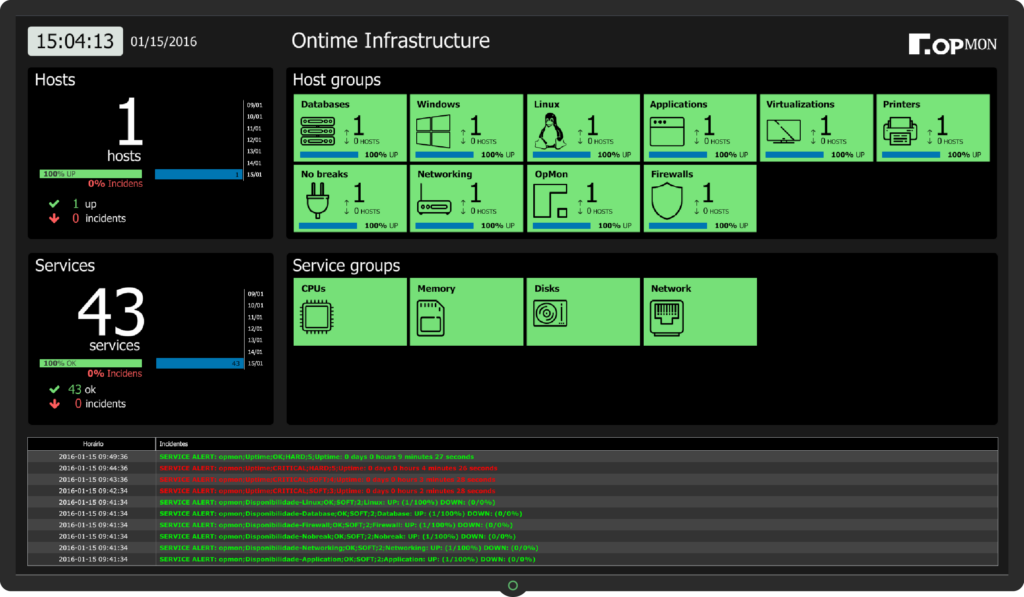
1. Management vision through Dashboards
OpMon has the best Dashboard builder in the IT monitoring market. There is no competitor with the same robustness to create dynamic and interactive visualizations presenting online indicators for IT and business areas.
2. High scalability
A robust product to support the monitoring of complex infrastructures. At some customers, more than 35 thousand indicators are monitored with high performance. Possibility of clustering for parallelization and guarantee of maximum availability.
3. Integration with Service Desk
Possibility of integrating Webservices with different Service Desk tools for automatic opening of calls from critical events in OpMon. It allows to define the person in charge for the resolution of problems according to the type of device (IC) or attribute (AIC).
4. Unified monitoring
OpMon proposes to centralize metrics of any system or device that generates data, such as servers, routers, switches, database, Internet links, SAP systems, among others. All with (e-mail, SMS or Push) automated alerts, triggered when a problem occurs.
5. Services catalog
Mapping all logical rooms for services delivery. Rooms can be organized in a serial, hierarchical, contingent/parallel fashion and even with interdependencies among services. It lets you discover the users affected, the impact of the incident and the root cause of the problem.
6. Complete health reports for your environment
Capacity Reporting, Service Level Management, Capacity/Performance and Summary of Alerts are essential to ensure the availability of IT and business services. In addition, it allows automatic scheduling of reporting.
7. Network traffic analysis
A module for analysis of network traffic with detection of which protocols consume more data in the network as well as the origin and destination of the traffic. Unlimited probes!
8. Monitoring the user experience
A module for building robots that simulate user routines using applications. A graphical and intuitive interface for building robots that recognize images without the need for programming. It generates screenshots of error screens for immediate action.
9. Capacity, performance and baselines
Capacity and performance reports that allow future projection of resource depletion based on historical data. In addition, it allows the creation of dynamic trend lines that avoid false positives by identifying expected behaviors.
10. Transformation of knowledge into software
A flexible solution to monitoring any device that generates data. If some type of data is generated, it is possible to monitor with OpMon. For more than 14 years translating the clients’ problems into national software, with a Brazilian team and near you!

We want you to be able to monitor your entire IT infrastructure as well as all the infrastructure that supports the business and to give visibility to your management through Dashboards in real time at an extremely competitive price!
If you have the challenge of reducing IT costs or of monitoring business indicators in real time in 2017, we are willing to explain this in a remote or face-to-face meeting.


