

The view of your business in real-time
With the volume of information we are exposed to, it is vital to know which filter is most important for decision making. Today you can find information in real time from anywhere in the world, generate reports on the performance of your company or even their competitors. But the makers have time to absorb all this information?
Most often the answer is no. However, with the concept of Dashboards can minimize this problem. The most relevant information about the infrastructure or business process KPIs can be displayed on monitors scattered throughout the company.
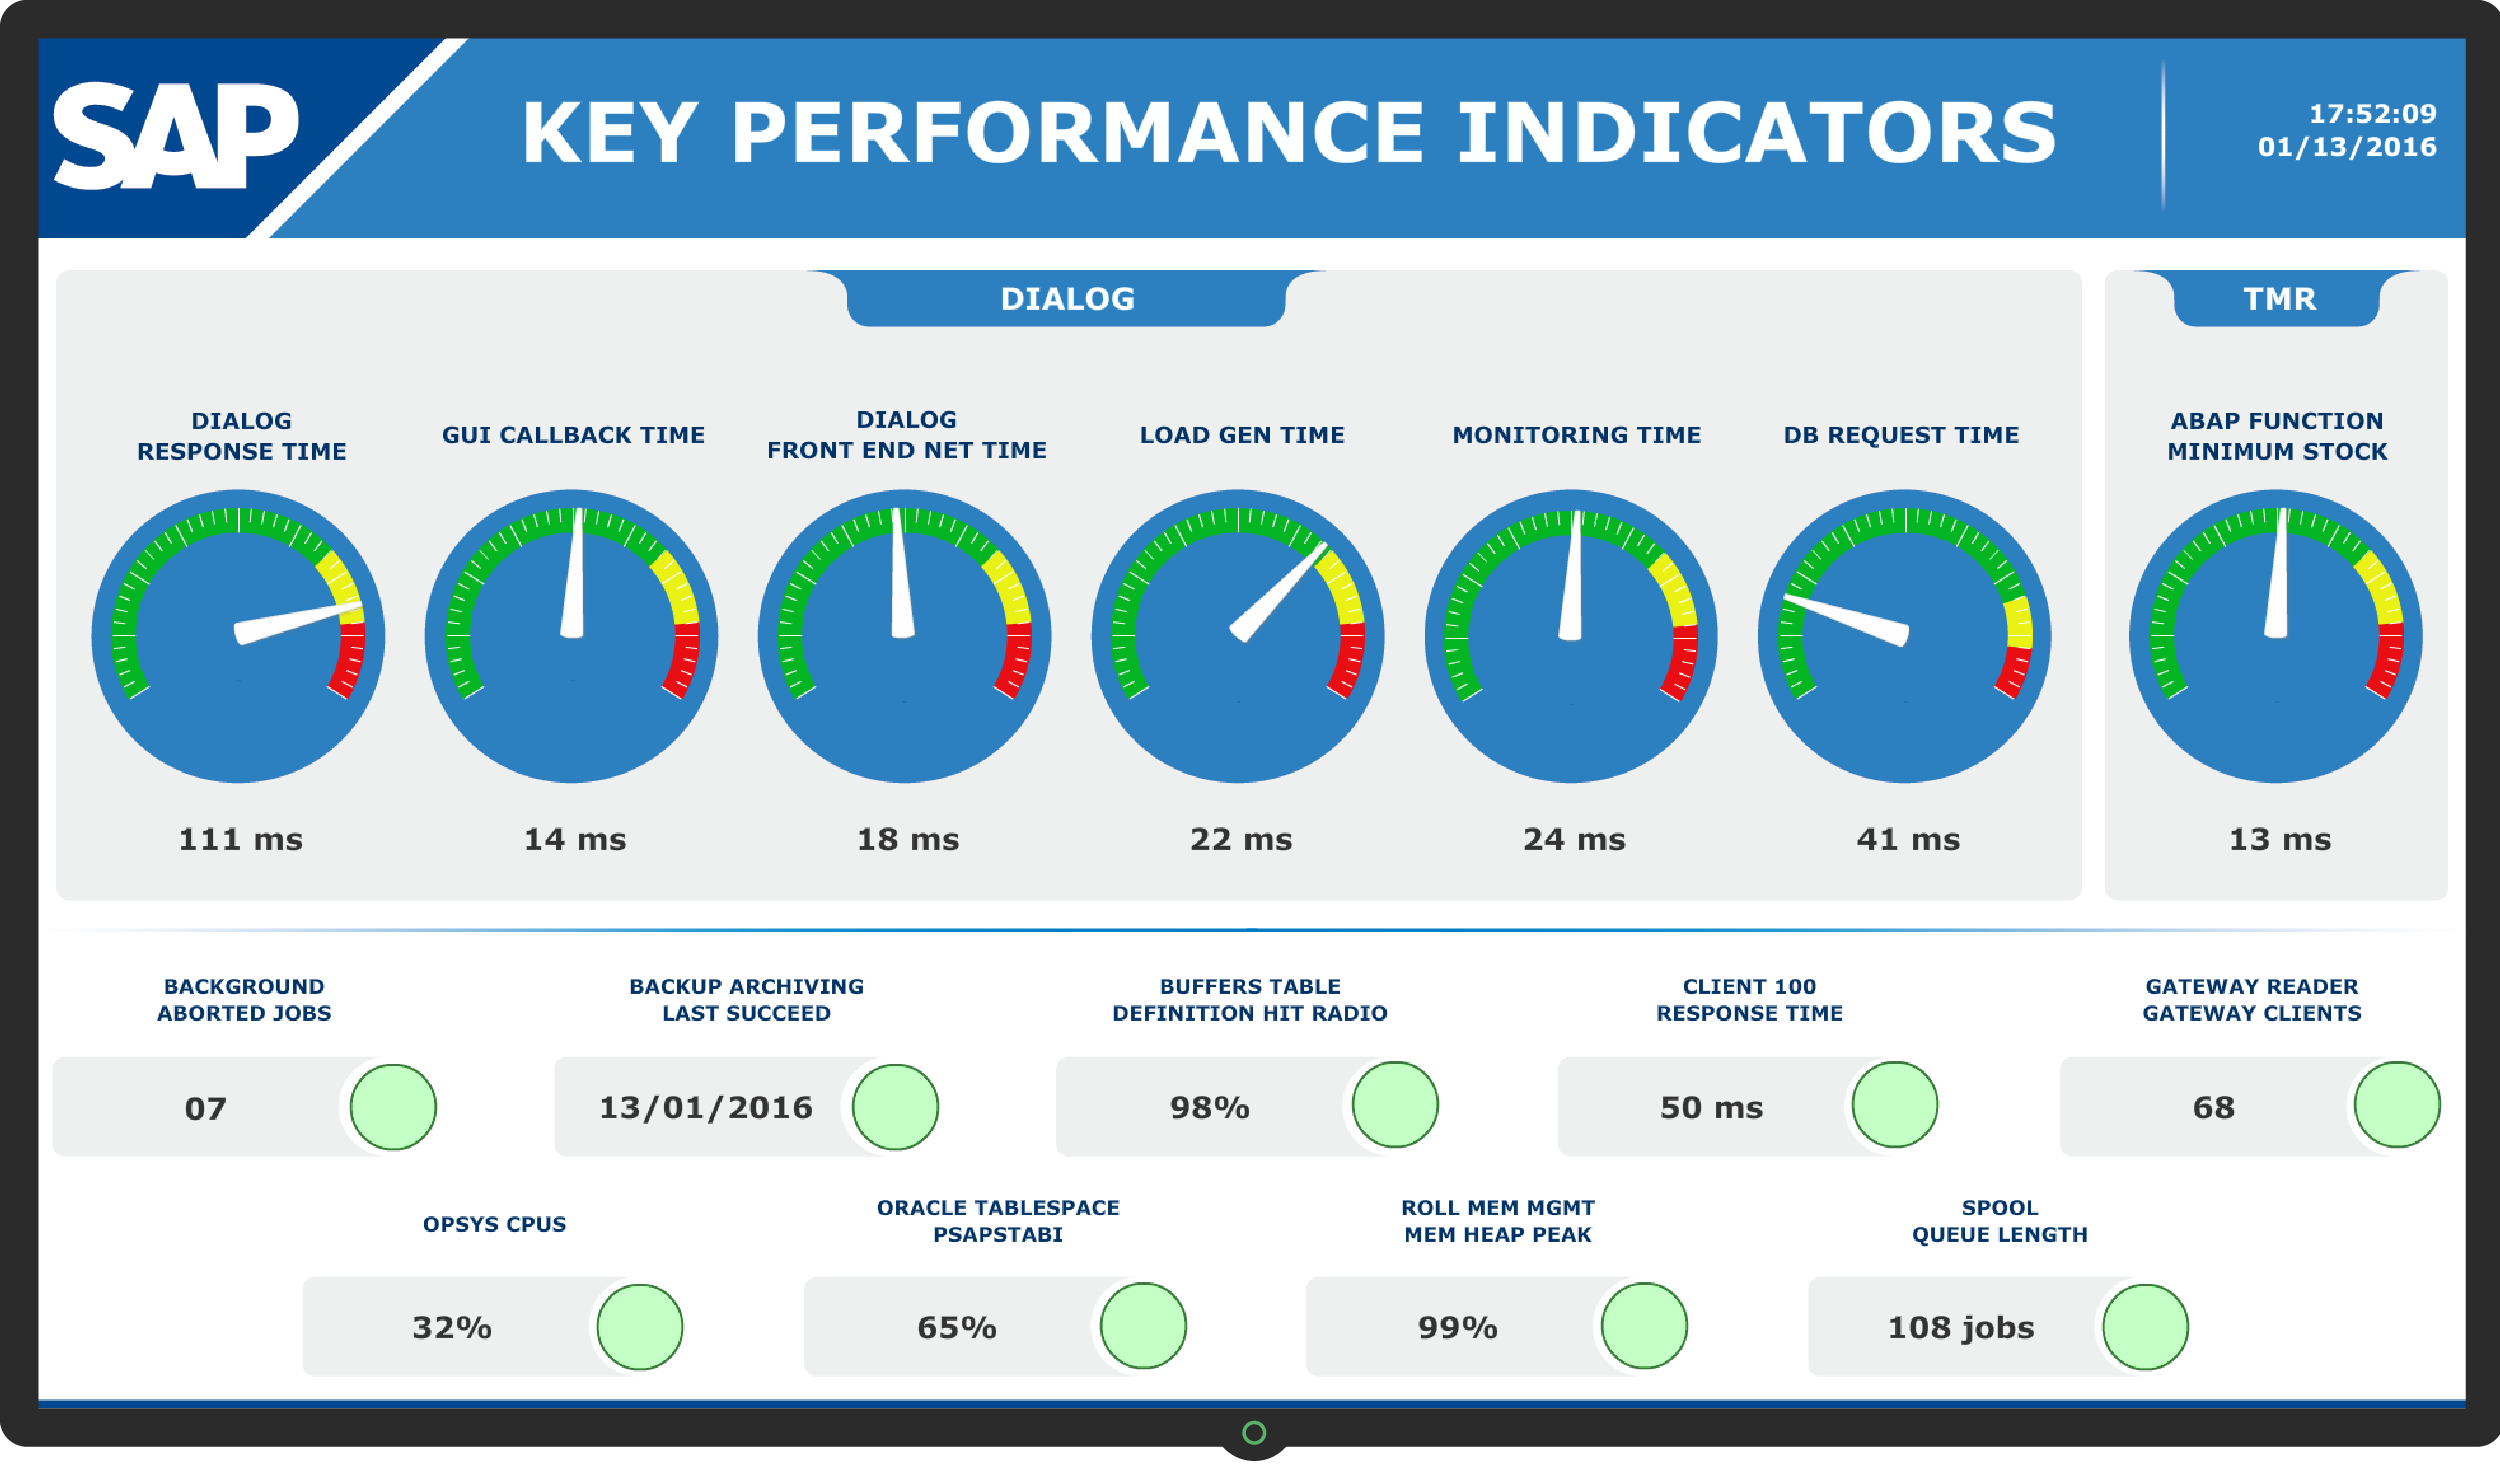
Dashboard – SAP Monitoring
Give visibility to your IT enviroment
Management determines which want to monitor KPIs and who wish to share. This information summarizes the situation of a particular area of the company through a status (critical, alert and ok) or numeric value. The result is that more informed decisions become, faster and with less risk of error.
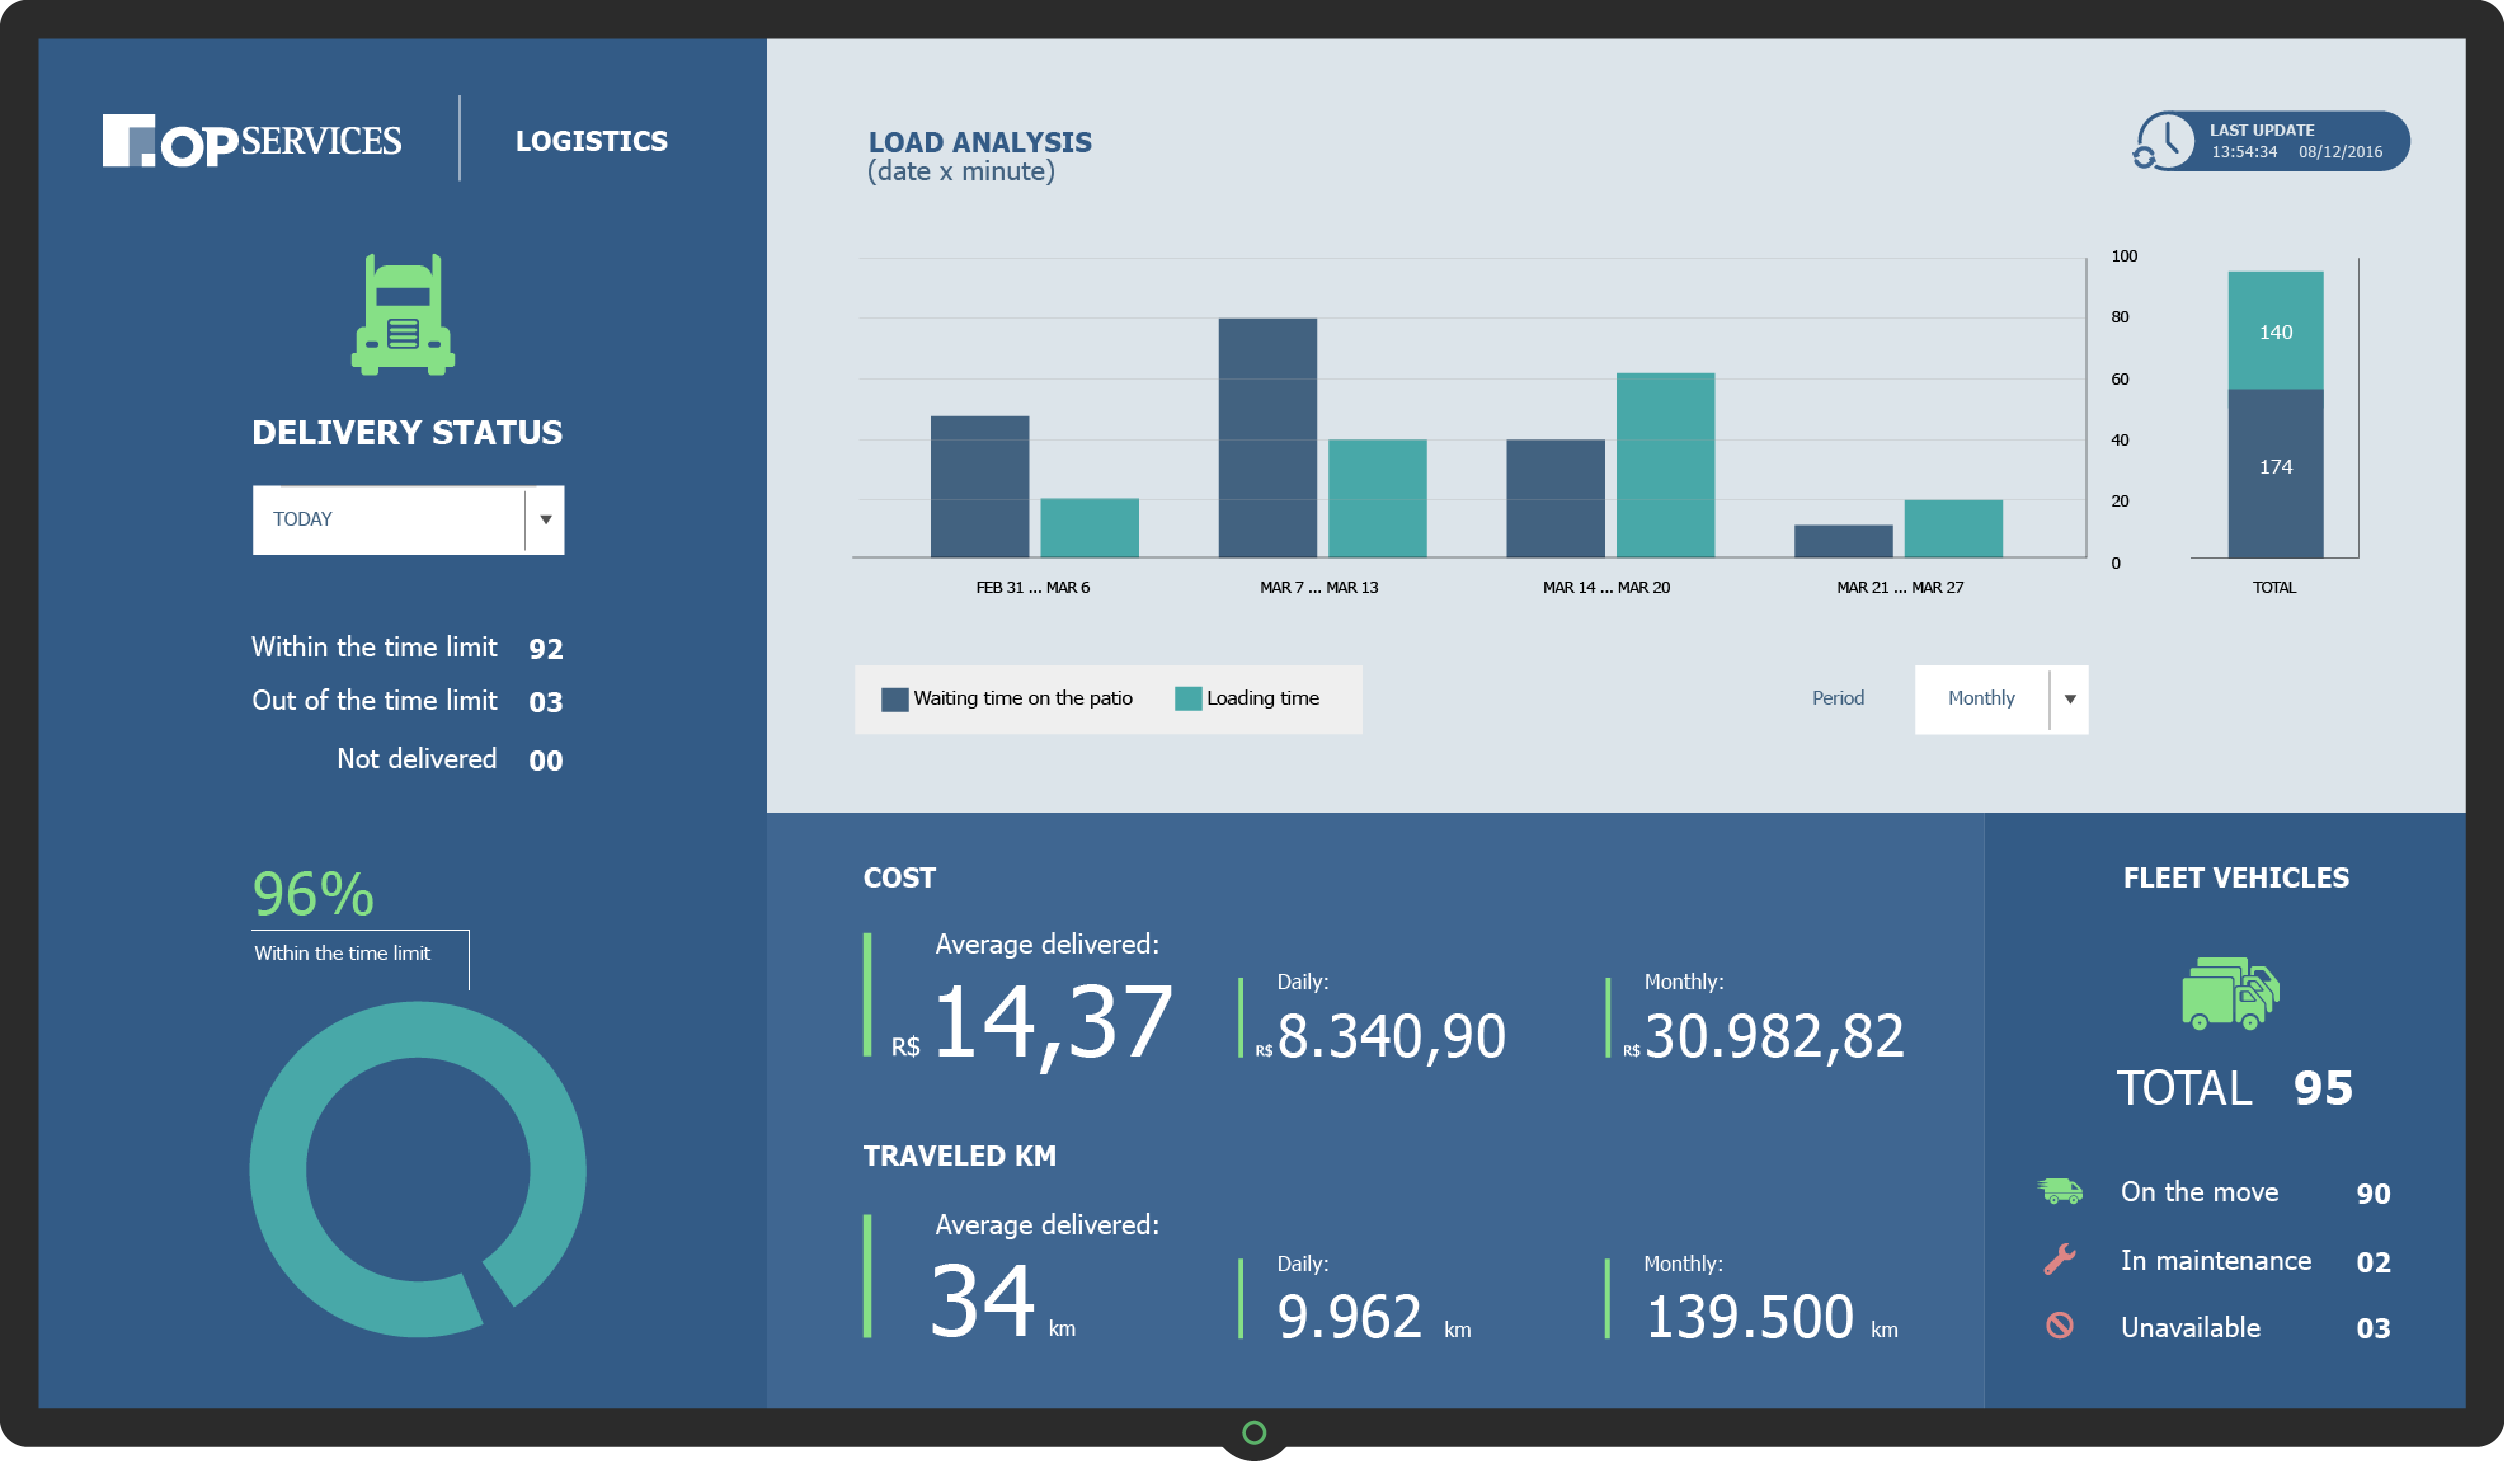
Logistic SCM Dashboard
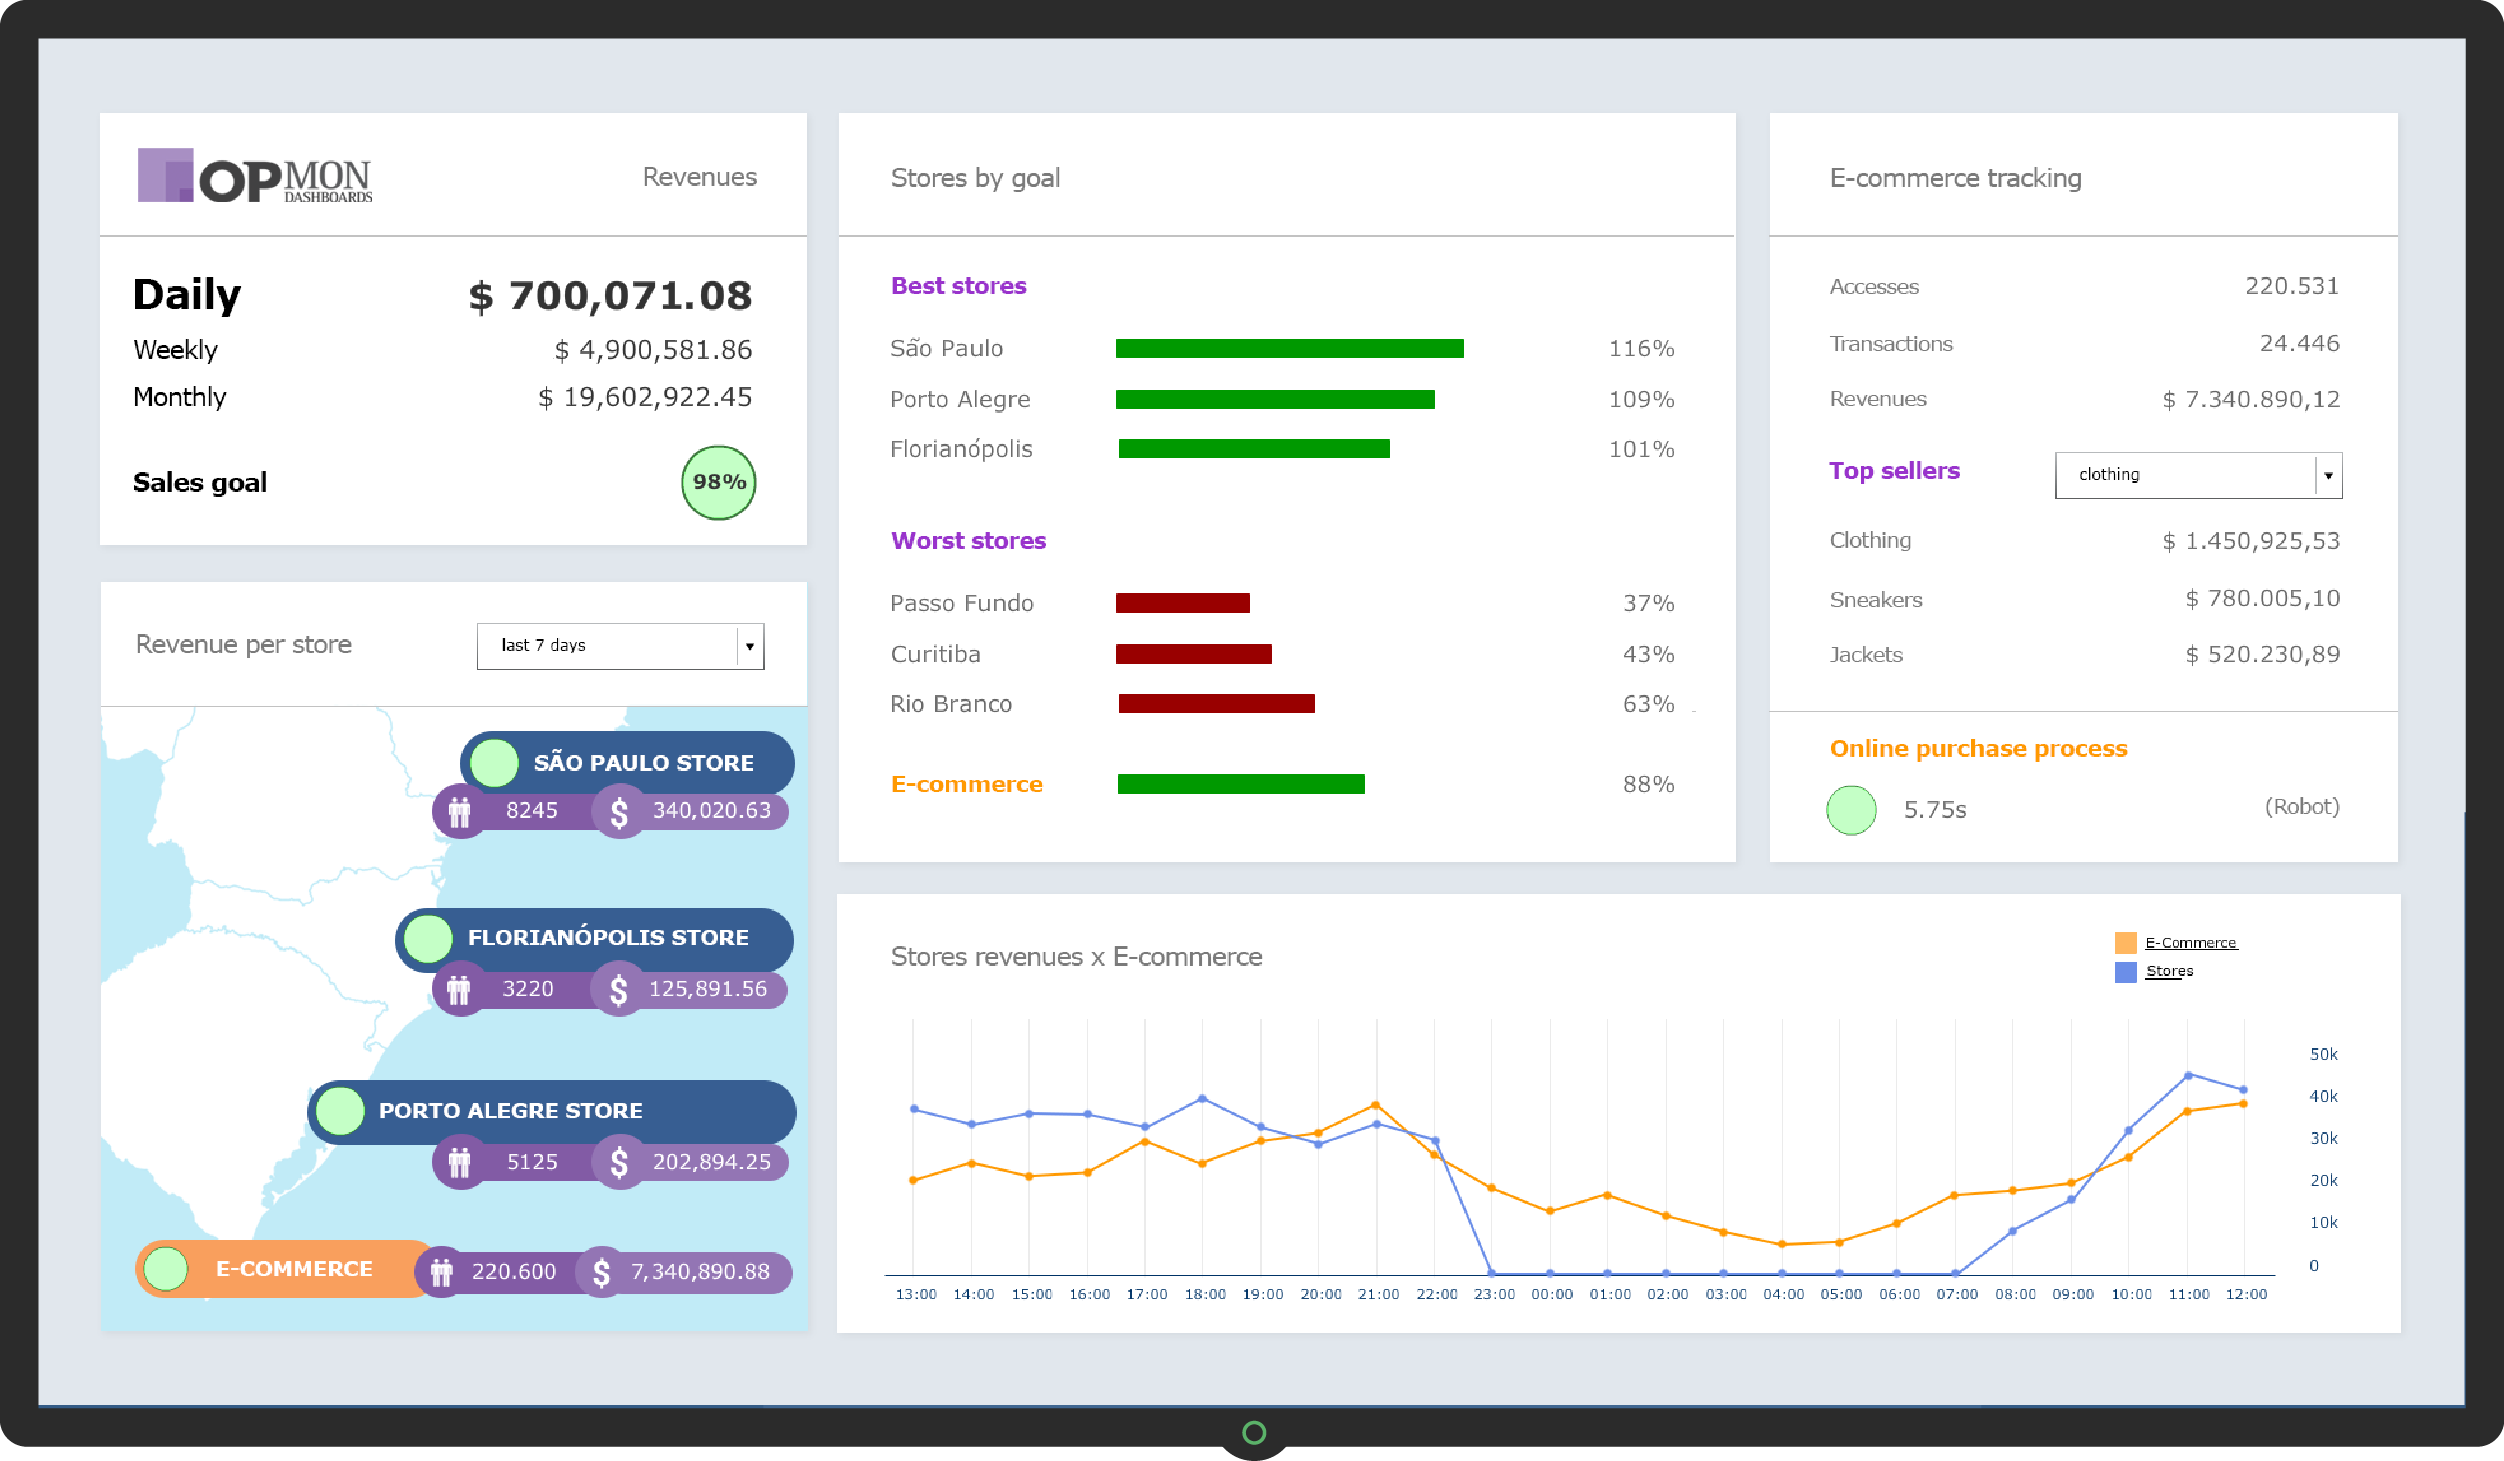
Thinking this market with great potential OpServices developed OpMon Dahsboards Editor. The solution allows the creation and editing of executive dashboards, so easy and intuitive, allowing users OpMon give broad visibility of the status of business processes and IT services through monitors, which can be easily understood by managers from other areas and thus facilitate the flow of strategic information to the business within companies.
What is the value of control panels with indicators based on items monitored IT infrastructure and business processes to make decisions in real time? For our customers this means a great competitive edge.
Features
- Viewing and editing dashboards;
- Monitoring KPIs;
- Intuitive interface system with drag-and-drop;
- Extensive library of elements and graphics;
- Viewing via the web;
- The dashboards can be shared through URLs and iframes and can be viewed without being logged on the interface;
- Indicators presented in the panels in real time.
View on tablets and smartphones
Dashboards with indicators of IT and business can be viewed on tablets and smartphones. By means of the OpMon Dashboard Presenter, a free app in the iTunes and Google Play, you can see all the dashboards built in the OpMon Dashboards. To learn more, visit the product Web page.
Requirements
To use the dashboards you must purchase the software license monitoring and Telecom infrastructure and business processes OpMon.


