Afinal, para que serve um dashboard?
Por conceito, um dashboard (no contexto de TI) é um painel visual composto por informações centralizadas. Ele representa de forma gráfica indicadores em geral, sejam de TI ou de negócio, centralizados em uma única tela.
De modo geral, os painéis visuais ou dashboards contém conjuntos de indicadores de determinada área ou globais de toda a organização. Um dos seus objetivos é o acompanhamento, de forma centralizada, da saúde do negócio para a tomada decisões baseada em dados.
Dashboard: a visão da saúde do seu negócio
Existem diversos tipos de dashboards e com propostas de públicos variadas, desde os mais técnicos até os focados na gestão. Enquanto os dashboards técnicos são específicos e focados em algumas tecnologias ou desempenho de uma parte de um processo organizacional, os dashboards de gestão apresentam o resumo dos indicadores que precisam acompanhados para que a empresa melhore a sua performance em um período curto de tempo.
Na OpServices, é mais comum desenvolvermos dashboards para a gestão. Construídos com o objetivo de que os gestores possam visualizar de forma clara e precisa os pontos mais relevantes sobre a performance de seu ambiente de TI ou negócio. De nada adianta termos todo o ambiente controlado e em perfeito funcionamento se os principais gestores da empresa não tem acesso a estas informações ou se estes dados chegam até eles em formato de planilhas longas e que não facilitam a tomada de decisões.
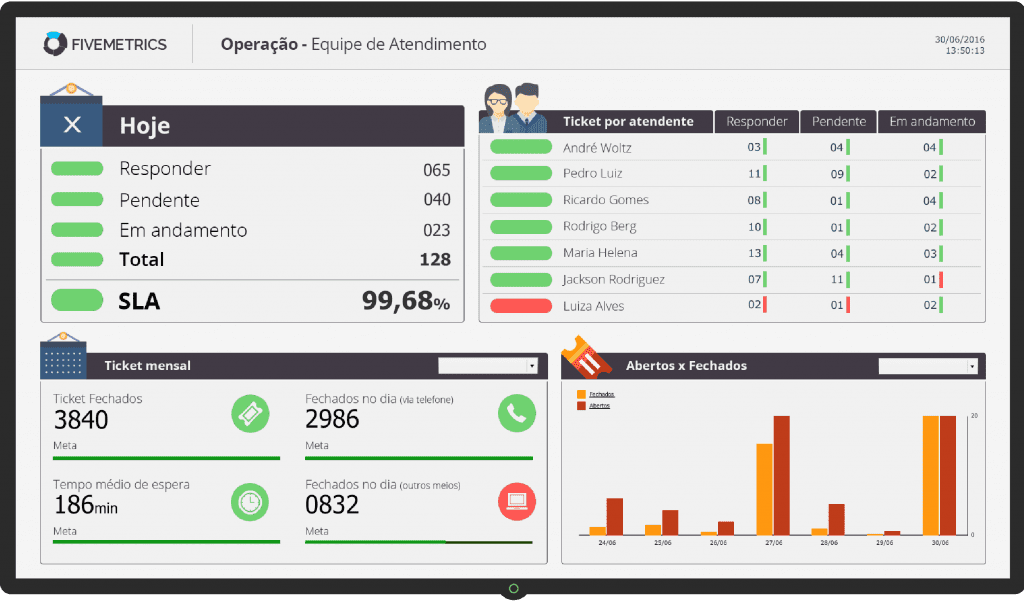
Por experiência acumulada em trabalhos desenvolvidos para clientes de médio e grande porte, as informações que realmente interessam aos CEOs, CIOs ou CFOs, são aquelas cujo os resultados podem ser melhorados no final do dia ou da semana. Veja no exemplo abaixo como um Gerente de Operações pode acompanhar o desempenho da sua equipe:
Muito mais do que uma visão rápida, os dashboards têm a função de resumir o desempenho geral da organização. Entretanto, podem dar diversos insights sobre melhorias nos processos. Veja algumas perguntas que podem ser respondidas com indicadores de negócios e visualizados através de um dashboard:
- Como está o andamento do meu negócio?
- A margem de lucro está de acordo com o esperado?
- Porque os clientes não estão efetivando a compra em minha loja virtual?
- Porque uma das filiais está produzindo menos calçados?
- Quantos leitos disponíveis temos para o setor de emergência?
- Quantos pacientes estão em espera por atendimento?
- Qual o desempenho dos sistemas críticos ou do serviço de internet?
Estes são alguns exemplos de perguntas que realmente interessam aos gestores. Ter estas informações representadas visualmente facilita muito na tomada de decisão sobre os processos da empresa.
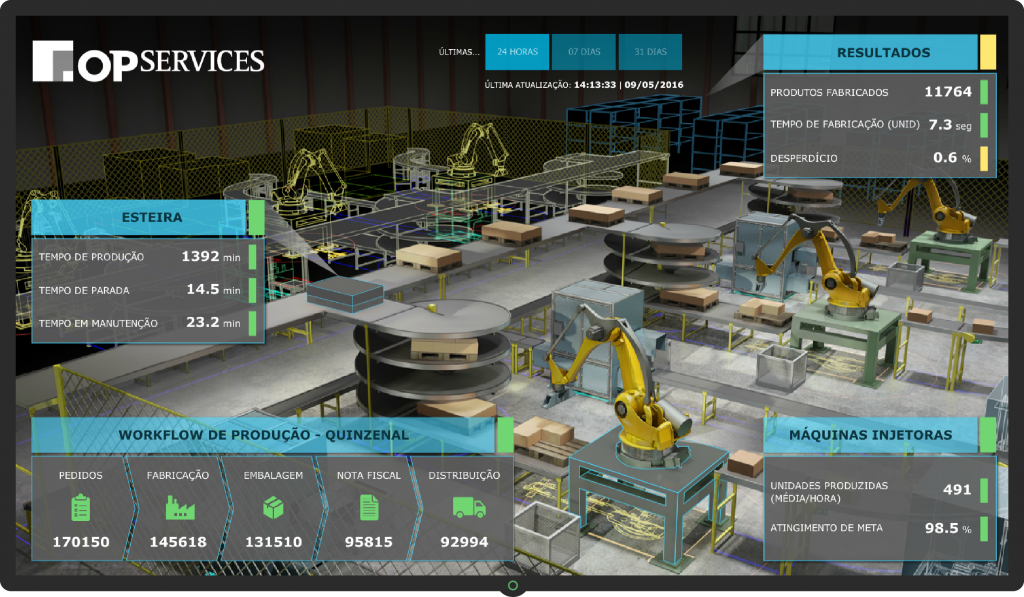
Neste outro exemplo, é possível visualizar indicadores de um processo de fabricação, como workflow de produção, resultados de desempenho fabril, nível de desperdício. Veja abaixo um exemplo desenvolvido pela OpServices em um projeto:
Atualmente, a demanda por soluções de gerenciamento de TI com um visualizador de dashboard aumentou significativamente. Além dos gestores quererem acompanhar de perto as operações e os processos de negócios, a transparência corporativa se tornou uma necessidade para empresas com capital aberto motivadas tanto por novas regulamentações quanto pela maior exigência dos consumidores.
Engana-se quem pensa que um dashboard é útil somente para os gestores, muitas empresas estão expondo os painéis com os processos de negócio em telas de 40’ em lugares estratégicos para que possam ser visualizados não somente por gerentes, mas também por todos os funcionários e algumas vezes até clientes. Isto, além de mostrar a transparência nos processos da empresa, também valoriza o trabalho da TI, pois aproxima a área dos demais setores e mostra de forma gráfica os resultados obtidos pelo através de um gerenciamento eficaz e preciso.
OpMon Dashboards
O desenvolvimento de visualizador e editor de dashboards para o OpMon surgiu a partir de demandas de clientes da OpServices. A partir de 2009, foi inclusa na solução um módulo de dashboard, na época conhecido como DaVINCI. Um dos diferenciais da solução sempre foi a liberdade para criar de acordo com as necessidades e especificidades de cada empresa. Ou seja, as informações não são padronizadas e geradas automaticamente.
É possível escolher exatamente quais são os indicadores que serão mostrados e fazer um drill down para localizar exatamente aonde se encontram os problemas e, desta forma, corrigí-los antes que os clientes percebam.

Um dos pontos fortes do OpMon Dashboards é a usabilidade. A ferramenta foi construída com uma interface intuitiva para que os usuários tenham total autonomia na hora da edição. Pode ser usado tanto por profissionais da TI quanto por designers sem muito conhecimento técnico.
Através da nossa experiência com mapeamento de KPIs do negócio de nossos clientes, de diversos segmentos, construímos um catálogo com modelos de indicadores que podem ser gerenciados com o OpMon Dashboards.
Clique para acessar o catálogo de dashboards.