
Learn about 5 possibilities of dashboards that your company can use
In the corporate universe it is vital to be able to count on updated and integrated information, to ensure the quality and effectiveness of various internal processes. In this sense, dashboards dashboards should be regarded as excellent management tools and can assist various hierarchical levels of the company. Through these control panels, or centralized indicators, it is possible to organize a series of data, which allow a much more comprehensive view of procedures and work routines, indicators and projects in development, including technical and financial aspects, as well as timelines and trends, helping to ensure a smarter and leaner management.
There are various types and models of dashboards, designed to meet specific needs and demands. Learn about some categories that we have identified as being directed to specific audiences within the organization.
Executive Dashboard
The executive dashboard allows viewing of large amounts of information, stratified and formatted properly, in order to facilitate the decision-making process. This panel uses visual and graphic resources to facilitate understanding. It is very useful to monitor indicators and KPIs, allowing for a complete analysis on all the company’s processes. It’s the so-called business dashboard and is used primarily to facilitate and streamline decision-making. For this to happen it is important that the data generated are updated in real time. After all, with the competitiveness of the markets it is no longer acceptable to use past data for decision making.
Usually they are based on the main management methodology, as, for example, the BSC or Balanced Scorecard. Through this kind of dashboard, all the executives may have access to important data for the assessment of new improvement opportunities or yet, for business expansion. The integration of the information provides a more effective and agile management, able to quickly align strategies, actions and decisions. The Executive Dashboard is able to simplify the whole data flow, reducing bureaucracy and adding value.
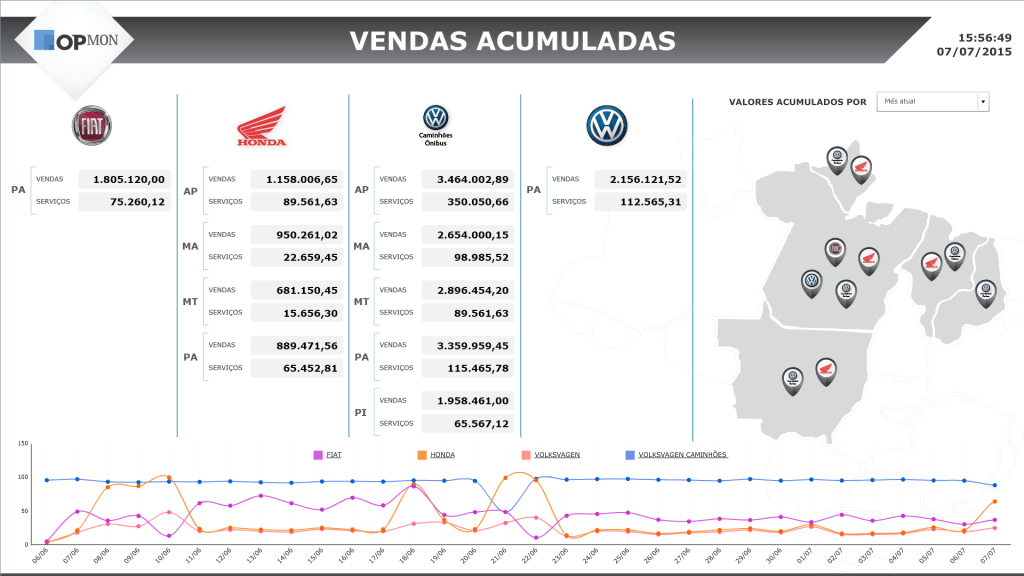
OpMon’s Dashboard with an eye on product sales
To learn more, download our whitepapers: Dashboards catalog with real examples and the Business Behavioral Monitoring.
Analytical dashboard
The analytical dashboard is prepared to provide more detailed information and is used to trace trends in relation to predetermined corporate objectives, i.e. to assess processes and projects that are progressing according to expectations. With constantly updated data, you can quickly realize the results of internal actions and the reactions of the market regarding products or services launched. It is a way to measure the impacts caused by every decision, being possible to intervene and correct the deviations more quickly, avoiding waste and losses. An example of a tool that produces these analytical dashboards is Google Analytics, a powerful Google tool to show marketing indicators, with data that range from access to the sites to the online sales bottleneck with indicators on conversion rates and traffic source mapping.
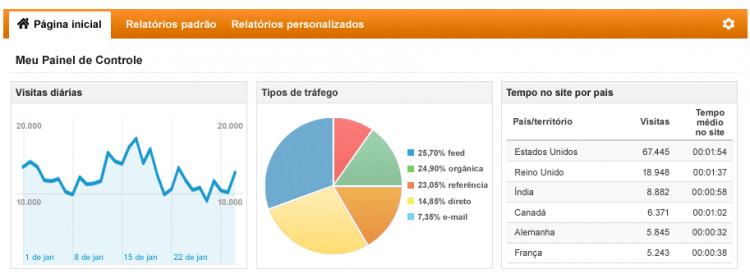
Google Analytics Dashboard
Operational dashboard
The operational dashboard is used directly by the work groups, with a focus on certain processes, enabling specific analysis. These data serve to identify bottlenecks and critical stages of the operation, providing assistance regarding specific problems and negative trends. With simplicity, they make communication very easy and still allow the interaction and the update of all professionals involved. Among the examples of operational dashboards there can be pointed out the indicators view with information about the infrastructure that supports the business.
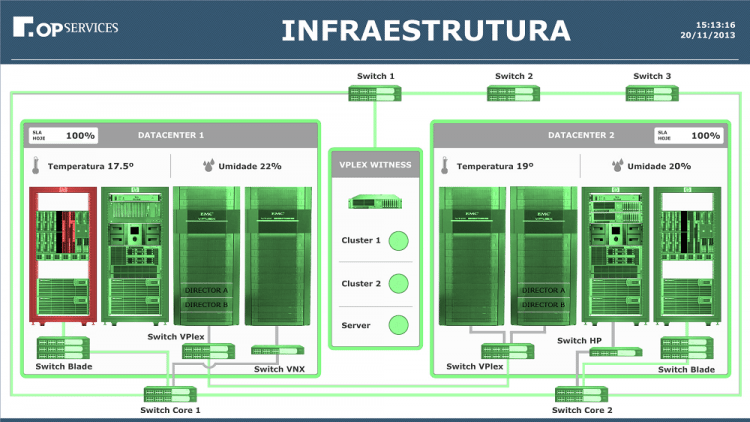
OpMon’s dashboard with an eye on datacenter infrastructure
Project management dashboard
Through this dashboard it is possible to monitor all the management of the project, including the evolution of each stage, the schedule, the planned activities, interdependencies and the percentage of completion of the project. This control panel also combines some techniques, such as conditional formatting, references and graphics, which allow easy understanding of all this information, reducing risk and optimizing the available resources.
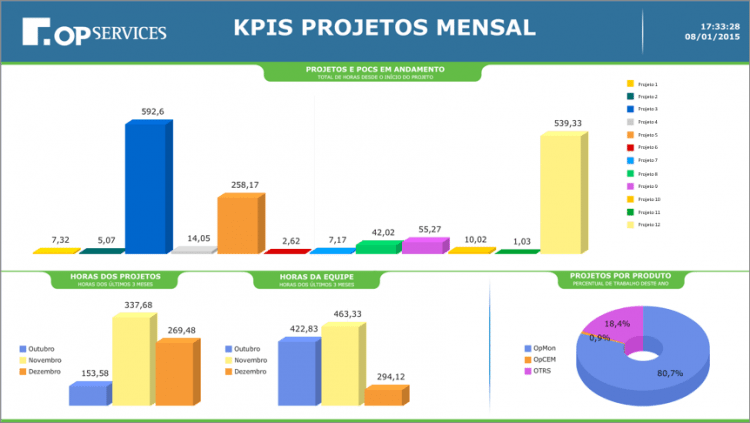
OpMon’s dashboard with an eye on Projects indicators
Customer service dashboard via call center
With the adoption of a customer service dashboard, the Manager is able to monitor all the call center of a company. This is a very versatile solution, structured to develop various statistics and comparative reports, involving data such as number of calls per period and per collaborator, duration of each assistance, cases solved or pending arrangements, nature of the contact and evaluation of customer satisfaction, just to name a few.
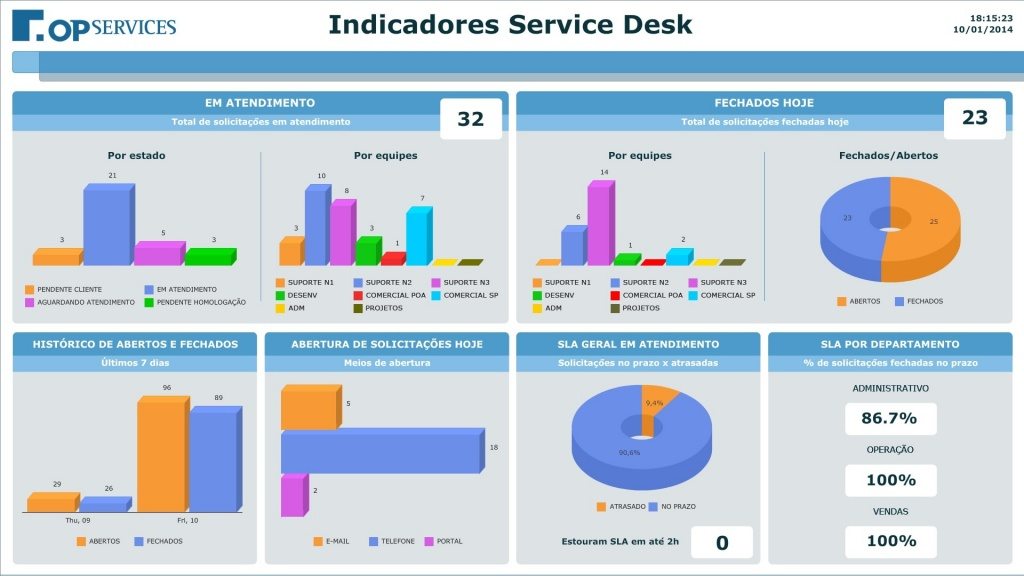
OpMon’s dashboard with an eye on Service Desk indicators
In a nutshell: Dashboards are information panels that graphically show the indicators of IT and business processes of a company. These panels contain indicators, charts, reports and specific filters presenting the most important information aligned on one screen to facilitate monitoring of the business and decision-making. To learn more about dashboards, click on the links of the related contents. or request a proposal if you wish to receive a quote for a deployment project of business processes dashboards in your company.
Related Content
Visual Management and real-time business processes monitoring
The death of the excel spreadsheet to manage indicators!
How to monitor business processes with OpMon?
What is visual management and how to apply it to your business?